Application benchmarking
Overview
Application benchmarking is an elementary skill for any performance engineering effort. Because it is the base for all other activities, it is crucial to measure results in an accurate, deterministic and reproducible way. The following components are required for meaningful application benchmarking:
- Timing: How to accurately measure time durations in software.
- Documentation: Because there are many influences on performance, it is essential to document all possible performance-relevant influences.
- System configuration: Modern systems allow to adjust many performance-relevant settings like clock speed, memory configuration, cache organisation as well as OS related settings.
- Resource allocation and affinity control: What resources are used, and how work is mapped onto resources.
Because so many things can go wrong during benchmarking, it is important to have a sceptical attitude towards good results. Especially for very good results one has to check multiple times if the result is reasonable. Further results must be deterministic and reproducible, if required statistical distribution over multiple runs has to be documented.
Prerequisite for any benchmarking activity is to get a quit EXCLUSIVE SYSTEM!
Preparation
At the beginning it must be defined what configuration and/or test case is examined. Especially for large application codes with a wide range of functionality this is essential. Application benchmarking requires to run the code under observation many times with different settings or variants. A test case therefore should have a short runtime, which is long enough for accurate time measurement, but does not run too long for a quick turnaround cycle. Ideally a benchmark runs from several seconds to a few minutes.
For very large and complex codes, one can extract performance-critical parts into so-called proxy apps, which are easier to handle and benchmark, but still resemble the behaviour of the real application code.
After deciding on a test case, it is required to specify a performance metric. A performance metric is usually useful work per time unit and allows comparing the performance of different test cases or setups. If it is difficult to define an application-specific work unit one over time or MFlops/s is a reasonable fallback solution. Examples for useful work are requests answered, lattice site updates, voxel updates, frames per second and so on.
Timing
For benchmarking, an accurate wallclock timer (end-to-end stop watch) is required. Every timer has a minimal time duration that can be measured. Therefore, if the code region to be measured is too short, the measurement must be extended until it reaches a time duration that can be resolved by the timer. There are OS-specific routines (POSIX and Windows), as well as programming-model or programming-language-specific solutions available. The latter have the advantage to be portable across operating systems. In any case, one has to read the documentation to ensure the exact properties of the routine used.
Recommended timing routines are
clock_gettime(), POSIX compliant timing function (man page) which is recommended as a replacement to the widespreadgettimeofday()MPI_Wtimeandomp_get_wtime, standardised programming-model-specific timing routine for MPI and OpenMP- Timing in instrumented Likwid regions based on cycle counters for very short measurements
While there are also programming language specific solutions (e.g. in C++ and Fortran), it is recommended to use the OS solution. In case of Fortran this requires to provide a wrapper function to the C function call (see example below).
Examples
Calling clock_gettime
Put the following code in a C module.
#include <time.h>

double mysecond()
{
    struct timespec ts;
    clock_gettime(CLOCK_MONOTONIC, &ts);
    return (double)ts.tv_sec + (double)ts.tv_nsec * 1.e-9;
}
You can use it in your code like that:
double S, E;

S = mysecond();
/* Your code to measure */
E = mysecond();

printf("Time: %f s\n",E-S);
Fortran example
In Fortran just add the following wrapper to above C module. You may have to adjust the name mangling to your Fortran compiler. You can just link with your Fortran application against the generated object file.
double mysecond_()
{
    return mysecond();
}
Use in your Fortran code as follows:
DOUBLE PRECISION s, e

 s = mysecond()
! Your code
 e = mysecond()

print *, "Time: ",e-s,"s"
Example code
The example code contains a ready-to-use timing routine with C and F90 examples as well as a more advanced timer C module based on the RDTSC instruction. You can download an archive containing working timing routines with examples here. For a working real example project including above timing module you can have a look at The Bandwidth Benchmark teaching code.
Documentation
Without a proper documentation of code generation, system state and runtime modalities, it can be difficult to reproduce performance results. Best practice is to automate the automatic logging of build settings, system state and runtime settings using automated benchmark scripts. Still, too much automation might also result in errors or hinder a fast workflow due to inflexibilities in benchmarking or intransparency of what actually happens. Therefore it is recommended to also execute steps by hand in addition to automated benchmark execution.
Node topology
Knowledge about node topology and properties is essential to plan benchmarking and interpret results. Important questions to ask are (Also see the extended list below):
- What is the topology and size of all memory hierarchy levels.
- Which caches levels are private to cores and which are shared?
- How many and which processors share memory hierarchy levels?
- What is the NUMA topology? This means how many and which processors share a memory interface and how many memory interfaces are there?
- Is SMT available? How many and which processors share a core?
- On Intel processors: Is cluster on die mode enabled? With cluster on die the memory interfaces within one socket are cut in two parts.
The Likwid tools provide a single tool likwid-topology reporting all required topology and memory hierarchy info from a single source.
Example usage:
$ likwid-topology -g
--------------------------------------------------------------------------------
CPU name:	Intel(R) Xeon(R) CPU E5-2695 v3 @ 2.30GHz
CPU type:	Intel Xeon Haswell EN/EP/EX processor
CPU stepping:	2
********************************************************************************
Hardware Thread Topology
********************************************************************************
Sockets:		2
Cores per socket:	14
Threads per core:	2
--------------------------------------------------------------------------------
HWThread	Thread		Core		Socket		Available
0		0		0		0		*
1		0		1		0		*
2		0		2		0		*
shortened
53		1		25		1		*
54		1		26		1		*
55		1		27		1		*
--------------------------------------------------------------------------------
Socket 0:		( 0 28 1 29 2 30 3 31 4 32 5 33 6 34 7 35 8 36 9 37 10 38 11 39 12 40 13 41 )
Socket 1:		( 14 42 15 43 16 44 17 45 18 46 19 47 20 48 21 49 22 50 23 51 24 52 25 53 26 54 27 55 )
--------------------------------------------------------------------------------
********************************************************************************
Cache Topology
********************************************************************************
Level:			1
Size:			32 kB
Cache groups:		( 0 28 ) ( 1 29 ) ( 2 30 ) ( 3 31 ) ( 4 32 ) ( 5 33 ) ( 6 34 ) ( 7 35 ) ( 8 36 ) ( 9 37 ) ( 10 38 ) ( 11 39 ) ( 12 40 ) ( 13 41 ) ( 14 42 ) ( 15 43 ) ( 16 44 ) ( 17 45 ) ( 18 46 ) ( 19 47 ) ( 20 48 ) ( 21 49 ) ( 22 50 ) ( 23 51 ) ( 24 52 ) ( 25 53 ) ( 26 54 ) ( 27 55 )
--------------------------------------------------------------------------------
Level:			2
Size:			256 kB
Cache groups:		( 0 28 ) ( 1 29 ) ( 2 30 ) ( 3 31 ) ( 4 32 ) ( 5 33 ) ( 6 34 ) ( 7 35 ) ( 8 36 ) ( 9 37 ) ( 10 38 ) ( 11 39 ) ( 12 40 ) ( 13 41 ) ( 14 42 ) ( 15 43 ) ( 16 44 ) ( 17 45 ) ( 18 46 ) ( 19 47 ) ( 20 48 ) ( 21 49 ) ( 22 50 ) ( 23 51 ) ( 24 52 ) ( 25 53 ) ( 26 54 ) ( 27 55 )
--------------------------------------------------------------------------------
Level:			3
Size:			18 MB
Cache groups:		( 0 28 1 29 2 30 3 31 4 32 5 33 6 34 ) ( 7 35 8 36 9 37 10 38 11 39 12 40 13 41 ) ( 14 42 15 43 16 44 17 45 18 46 19 47 20 48 ) ( 21 49 22 50 23 51 24 52 25 53 26 54 27 55 )
--------------------------------------------------------------------------------
********************************************************************************
NUMA Topology
********************************************************************************
NUMA domains:		4
--------------------------------------------------------------------------------
Domain:			0
Processors:		( 0 28 1 29 2 30 3 31 4 32 5 33 6 34 )
Distances:		10 21 31 31
Free memory:		15409.4 MB
Total memory:		15932.8 MB
--------------------------------------------------------------------------------
Domain:			1
Processors:		( 7 35 8 36 9 37 10 38 11 39 12 40 13 41 )
Distances:		21 10 31 31
Free memory:		15298.2 MB
Total memory:		16125.3 MB
--------------------------------------------------------------------------------
Domain:			2
Processors:		( 14 42 15 43 16 44 17 45 18 46 19 47 20 48 )
Distances:		31 31 10 21
Free memory:		15869.4 MB
Total memory:		16125.3 MB
--------------------------------------------------------------------------------
Domain:			3
Processors:		( 21 49 22 50 23 51 24 52 25 53 26 54 27 55 )
Distances:		31 31 21 10
Free memory:		15876.6 MB
Total memory:		16124.4 MB
--------------------------------------------------------------------------------


********************************************************************************
Graphical Topology
********************************************************************************
Socket 0:
+-----------------------------------------------------------------------------------------------------------------------------------------------------------+
| +--------+ +--------+ +--------+ +--------+ +--------+ +--------+ +--------+ +--------+ +--------+ +--------+ +--------+ +--------+ +--------+ +--------+ |
| |  0 28  | |  1 29  | |  2 30  | |  3 31  | |  4 32  | |  5 33  | |  6 34  | |  7 35  | |  8 36  | |  9 37  | | 10 38  | | 11 39  | | 12 40  | | 13 41  | |
| +--------+ +--------+ +--------+ +--------+ +--------+ +--------+ +--------+ +--------+ +--------+ +--------+ +--------+ +--------+ +--------+ +--------+ |
| +--------+ +--------+ +--------+ +--------+ +--------+ +--------+ +--------+ +--------+ +--------+ +--------+ +--------+ +--------+ +--------+ +--------+ |
| |  32 kB | |  32 kB | |  32 kB | |  32 kB | |  32 kB | |  32 kB | |  32 kB | |  32 kB | |  32 kB | |  32 kB | |  32 kB | |  32 kB | |  32 kB | |  32 kB | |
| +--------+ +--------+ +--------+ +--------+ +--------+ +--------+ +--------+ +--------+ +--------+ +--------+ +--------+ +--------+ +--------+ +--------+ |
| +--------+ +--------+ +--------+ +--------+ +--------+ +--------+ +--------+ +--------+ +--------+ +--------+ +--------+ +--------+ +--------+ +--------+ |
| | 256 kB | | 256 kB | | 256 kB | | 256 kB | | 256 kB | | 256 kB | | 256 kB | | 256 kB | | 256 kB | | 256 kB | | 256 kB | | 256 kB | | 256 kB | | 256 kB | |
| +--------+ +--------+ +--------+ +--------+ +--------+ +--------+ +--------+ +--------+ +--------+ +--------+ +--------+ +--------+ +--------+ +--------+ |
| +--------------------------------------------------------------------------+ +--------------------------------------------------------------------------+ |
| |                                   18 MB                                  | |                                   18 MB                                  | |
| +--------------------------------------------------------------------------+ +--------------------------------------------------------------------------+ |
+-----------------------------------------------------------------------------------------------------------------------------------------------------------+
Socket 1:
+-----------------------------------------------------------------------------------------------------------------------------------------------------------+
| +--------+ +--------+ +--------+ +--------+ +--------+ +--------+ +--------+ +--------+ +--------+ +--------+ +--------+ +--------+ +--------+ +--------+ |
| | 14 42  | | 15 43  | | 16 44  | | 17 45  | | 18 46  | | 19 47  | | 20 48  | | 21 49  | | 22 50  | | 23 51  | | 24 52  | | 25 53  | | 26 54  | | 27 55  | |
| +--------+ +--------+ +--------+ +--------+ +--------+ +--------+ +--------+ +--------+ +--------+ +--------+ +--------+ +--------+ +--------+ +--------+ |
| +--------+ +--------+ +--------+ +--------+ +--------+ +--------+ +--------+ +--------+ +--------+ +--------+ +--------+ +--------+ +--------+ +--------+ |
| |  32 kB | |  32 kB | |  32 kB | |  32 kB | |  32 kB | |  32 kB | |  32 kB | |  32 kB | |  32 kB | |  32 kB | |  32 kB | |  32 kB | |  32 kB | |  32 kB | |
| +--------+ +--------+ +--------+ +--------+ +--------+ +--------+ +--------+ +--------+ +--------+ +--------+ +--------+ +--------+ +--------+ +--------+ |
| +--------+ +--------+ +--------+ +--------+ +--------+ +--------+ +--------+ +--------+ +--------+ +--------+ +--------+ +--------+ +--------+ +--------+ |
| | 256 kB | | 256 kB | | 256 kB | | 256 kB | | 256 kB | | 256 kB | | 256 kB | | 256 kB | | 256 kB | | 256 kB | | 256 kB | | 256 kB | | 256 kB | | 256 kB | |
| +--------+ +--------+ +--------+ +--------+ +--------+ +--------+ +--------+ +--------+ +--------+ +--------+ +--------+ +--------+ +--------+ +--------+ |
| +--------------------------------------------------------------------------+ +--------------------------------------------------------------------------+ |
| |                                   18 MB                                  | |                                   18 MB                                  | |
| +--------------------------------------------------------------------------+ +--------------------------------------------------------------------------+ |
+-----------------------------------------------------------------------------------------------------------------------------------------------------------
Dynamic processor clock
Older processors supported to dynamically decrease the clock to save power. Newer multicore processors in addition are capable of dynamically overclocking beyond the nominal frequency. On Intel processors this feature is called "turbo mode". Turbo mode is a flavor of so called "dark silicon" optimisations. A chip has a thermal design power (TDP). The TDP is the maximum heat the chip can dissipate. The power a chip consumes depends on the frequency and the square of the voltage it is operated with and of course the total number of transistors and wires active. There is a minimum voltage the chip can be operated with using a given frequency. If not all cores are used parts of the chip can be turned off. This gives enough power headroom to increase the voltage and frequency and still stay within the TDP. The overclocking happens dynamically and is controlled by the hardware itself.
Many technological advances in processor designs are targeted on managing the power to stay within the TDP and still reach a high performance. This is reflected in different clock domains for cores and uncore and special SIMD width specific turbo mode clocks. This means if a code uses wider SIMD units more transistors and more important wires are active and the chip can therefore only run at a lower peak frequency.
Useful tools in this context are likwid-powermeter and likwid-setFrequencies. The former reports on Turbo mode steps, the latter on the current frequency settings. Note that likwid-powermeter reads out a special register to query the frequency steps for regular use but not for the special SIMD frequencies. Those frequencies are only available in the processor documentation from Intel. Also be aware that the documented peak frequencies are not guaranteed. Depending on the specific chip the actually reached frequency can be lower. A major complication for benchmarking is that on recent Intel chips even if turbo mode is disabled the chip may clock lower if using wide SIMD units. Again this is a dynamic process and depends on the specific chip. To be really sure one has to measure the actual average frequency with a a HPM tool as e.g. likwid-perfctr. Almost any likwid-perfctr performance group also shows the measured clock.
Below is an example for querying the Turbo mode steps of a Intel Skylake chip:
$likwid-powermeter -i
--------------------------------------------------------------------------------
CPU name:       Intel(R) Xeon(R) Gold 6148 CPU @ 2.40GHz
CPU type:       Intel Skylake SP processor
CPU clock:      2.40 GHz
--------------------------------------------------------------------------------
Base clock:     2400.00 MHz
Minimal clock:  1000.00 MHz
Turbo Boost Steps:
C0 3700.00 MHz
C1 3700.00 MHz
C2 3500.00 MHz
C3 3500.00 MHz
C4 3400.00 MHz
C5 3400.00 MHz
C6 3400.00 MHz
C7 3400.00 MHz
C8 3400.00 MHz
C9 3400.00 MHz
C10 3400.00 MHz
C11 3400.00 MHz
C12 3300.00 MHz
C13 3300.00 MHz
C14 3300.00 MHz
C15 3300.00 MHz
C16 3100.00 MHz
C17 3100.00 MHz
C18 3100.00 MHz
C19 3100.00 MHz
--------------------------------------------------------------------------------
Info for RAPL domain PKG:
Thermal Spec Power: 150 Watt
Minimum Power: 73 Watt
Maximum Power: 150 Watt
Maximum Time Window: 70272 micro sec

Info for RAPL domain DRAM:
Thermal Spec Power: 36.75 Watt
Minimum Power: 5.25 Watt
Maximum Power: 36.75 Watt
Maximum Time Window: 40992 micro sec

Info for RAPL domain PLATFORM:
Thermal Spec Power: 768 Watt
Minimum Power: 0 Watt
Maximum Power: 768 Watt
Maximum Time Window: 976 micro sec

Info about Uncore:
Minimal Uncore frequency: 1200 MHz
Maximal Uncore frequency: 2400 MHz

Performance energy bias: 6 (0=highest performance, 15 = lowest energy)

--------------------------------------------------------------------------------
Example output for likwid-setFrequencies:
$likwid-setFrequencies  -p
Current CPU frequencies:
CPU 0: governor     ondemand min/cur/max 1.0/1.000/2.401 GHz Turbo 0
CPU 1: governor     ondemand min/cur/max 1.0/1.001/2.401 GHz Turbo 0
CPU 2: governor     ondemand min/cur/max 1.0/1.004/2.401 GHz Turbo 0
CPU 5: governor     ondemand min/cur/max 1.0/1.000/2.401 GHz Turbo 0
CPU 6: governor     ondemand min/cur/max 1.0/1.000/2.401 GHz Turbo 0

... shortened

CPU 66: governor     ondemand min/cur/max 1.0/1.009/2.401 GHz Turbo 0
CPU 70: governor     ondemand min/cur/max 1.0/1.000/2.401 GHz Turbo 0
CPU 71: governor     ondemand min/cur/max 1.0/1.001/2.401 GHz Turbo 0
CPU 72: governor     ondemand min/cur/max 1.0/1.000/2.401 GHz Turbo 0
CPU 75: governor     ondemand min/cur/max 1.0/1.000/2.401 GHz Turbo 0
CPU 76: governor     ondemand min/cur/max 1.0/1.016/2.401 GHz Turbo 0
CPU 63: governor     ondemand min/cur/max 1.0/1.004/2.401 GHz Turbo 0
CPU 64: governor     ondemand min/cur/max 1.0/1.001/2.401 GHz Turbo 0
CPU 67: governor     ondemand min/cur/max 1.0/1.000/2.401 GHz Turbo 0
CPU 68: governor     ondemand min/cur/max 1.0/1.003/2.401 GHz Turbo 0
CPU 69: governor     ondemand min/cur/max 1.0/1.000/2.401 GHz Turbo 0
CPU 73: governor     ondemand min/cur/max 1.0/1.344/2.401 GHz Turbo 0
CPU 74: governor     ondemand min/cur/max 1.0/1.285/2.401 GHz Turbo 0
CPU 77: governor     ondemand min/cur/max 1.0/1.028/2.401 GHz Turbo 0
CPU 78: governor     ondemand min/cur/max 1.0/1.059/2.401 GHz Turbo 0
CPU 79: governor     ondemand min/cur/max 1.0/1.027/2.401 GHz Turbo 0

Current Uncore frequencies:
Socket 0: min/max 1.2/2.4 GHz
Socket 1: min/max 1.2/2.4 GHz
System configuration
The following node level settings can influence performance results.
| Item | Influence | Recommended setting |
|---|---|---|
| CPU clock | on everything | Make sure to use acpi_cpufreq, fix frequency, make sure the CPU's power management unit doesn't interfere (e.g., likwid-perfctr) |
| Turbo mode on/off | on CPU clock | for benchmarking deactivate |
| SMT on/off topology | on resource sharing on core | Can be left on on modern processors without penalty but complexity for affinity. |
| Frequency governor (performance,...) | on clock speed ramp-up | For benchmarking set so that clock speed is always fixed |
| Turbo steps | on freq vs. # cores | For benchmarking switch off turbo |
| Item | Influence | Recommended setting |
|---|---|---|
| Transparent huge pages | on (memory) bandwidth | /sys/kernel/mm/transparent_hugepage/enabled should be set to ŌĆśalwaysŌĆÖ |
| Cluster on die (COD) / Sub NUMA clustering (SNC) mode | on L3 and memory latency, (memory bandwidth via snoop mode on HSW/BDW) | Set in BIOS, check using numactl -H or likwid-topology |
| LLC prefetcher | on single-core memory bandwidth | Set in BIOS, no way to check without MSR |
| "Known" prefetchers | on latency and bandwidth of various levels in the cache/memory hierarchy | Set in BIOS or likwid-features, query status using likwid-features |
| Numa balancing | on (memory) data volume and performance | /proc/sys/kernel/numa_balancing if 1 the page migration is 'on', else 'off' |
| Memory configuration (channels, DIMM frequency, Single Rank/Dual Rank) | on Memory performance | Check with dmidecode or look at DIMMs |
| NUMA interleaving (BIOS setting) | on Memory BW | set in BIOS, switch off |
| Item | Influence | Recommended setting |
|---|---|---|
| Uncore clock | on L3 and memory bandwidth | Set it to maximum supported frequency (e.g., using likwid-setFrequency), make sure the CPU's power management unit doesn't interfere (e.g., likwid-perfctr) |
| QPI Snoop mode | on memory bandwidth | Set in BIOS, no way to check without MSR |
| Power cap | on freq throttling | Don't use |
Affinity control
Affinity control allows to specify on which execution resources (cores or SMT threads) Affinity control is crucial to
- eliminate performance variation
- make use of architectural features
- avoid resource contention
Almost any runtime environment comes with some kind of affinity control. With OpenMP 4 a standardized pinning interface was introduced. Most solutions are environment variable based. A command line wrapper alternative is available in the Likwid tools: likwid-pin and likwid-mpirun.
Best practices
There are two main variation dimensions for application benchmarking: Core count and data set size.
Scaling core count
Scaling the number of workers (and therefore processor cores) used tests the parallel scalability of an application and also reveals scaling bottlenecks in node architectures. To separate influences good practice is to first scale out inside a memory domain. Main memory bandwidth within one memory domain is currently the most important performance limiting shared resource on compute nodes. After scaling from 1 to n cores within one memory domain next is to scale across memory domains and finally across sockets with the previous case being the baseline for speedup. Finally one scales across nodes, again the baseline is now the single node result. This helps to separate different influences on scaling. One must be aware that there is no way to separate the pure parallel scalability influenced by e.g. serial fraction and load imbalance. For all scalability measurements the machine should be operated with fixed clock, that means Turbo mode has to be disabled. With Turbo mode turned on the result is influenced in addition by how sensitive the code is to frequency changes. For finding the optimal operating point for production it still might be important to also measure with Turbo mode enabled.
For plotting performance results larger should be better. Use either useful work per time or just inverse runtime as performance metric.
Besides the performance scaling you should also plot results as parallel speedup and efficiency. Parallel speedup is defined as
where N is the number of parallel workers. Ideal speedup is . The parallel efficiency is defined as
- .
A reasonable threshold for acceptable parallel efficiency could be for example 0.5.
To wrap it up here is what needs to be done:
- Set a fixed frequency
- Measure sequential baseline
- Scale within a memory domain with baseline sequential result
- Scale across memory domains with baseline one memory domain
- (if applicable) Scale across sockets with baseline one socket
- Scale across nodes with baseline one node
Scaling data set size
The target for this scaling variation is to ensure that all (most) data is loaded from a specific memory hierarchy level (e.g. L1 cache, last level cache or main memory). In some cases it is not possible to vary the data set size in fine steps, in such case the data set size should be varied such that data is located in every memory hierarchy location. This experiment should be initially performed with one worker and reveals if runtime contributions from data transfers add to the critical path. If performance is insensitive to where the data is loaded from it is likely that the code is not limited by data access costs. It is important to assure with hardware performance profiling that measured data volumes are in line with the desired target memory hierarchy level.
SMT feature
Many processors today support Simultaneous multithreading (SMT) as a technology to increase the usage of instruction level parallel processing (ILP). The processor allows to run multiple threads (common is 2, 4 or 8) simultaneously on one core, which gives the instruction scheduler more independent instructions to feed the execution pipelines. SMT may increase the efficient use of ILP but comes at the cost of synchronization penalty. For application benchmarking good practice is to measure for each topological entity once with and once without SMT to quantify the effect.
Interpretation of results
Parallel scaling patterns
In the following we discuss typical patterns that are relevant for parallel application scaling.
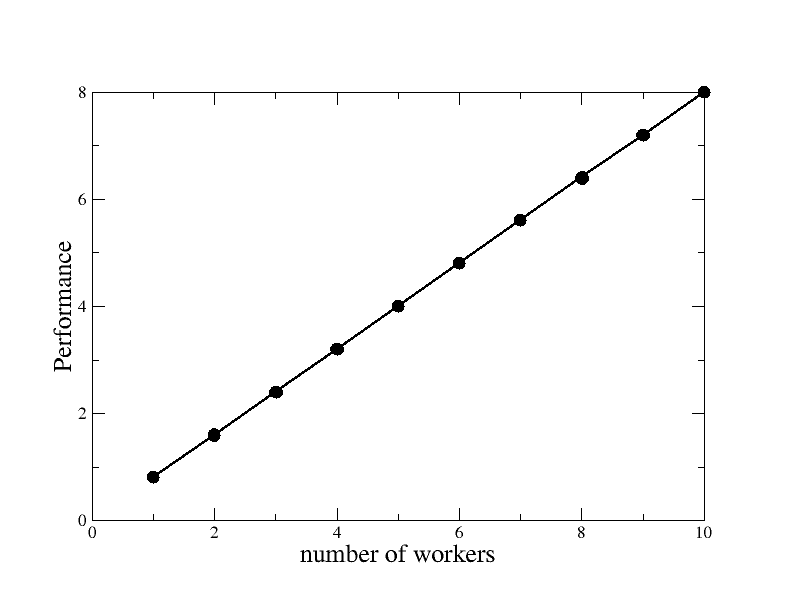
Linear pattern
This pattern occurs if no serious issues prevent a scalable performance. The slope may be anything smaller than 1 with 1 being optimal parallel scaling. This case applies if all used resources used by the code are also scalable (this means private to the worker: for example execution units or inner cache levels). Be aware that this may be caused by a very slow code that does not address any shared resource bottleneck.
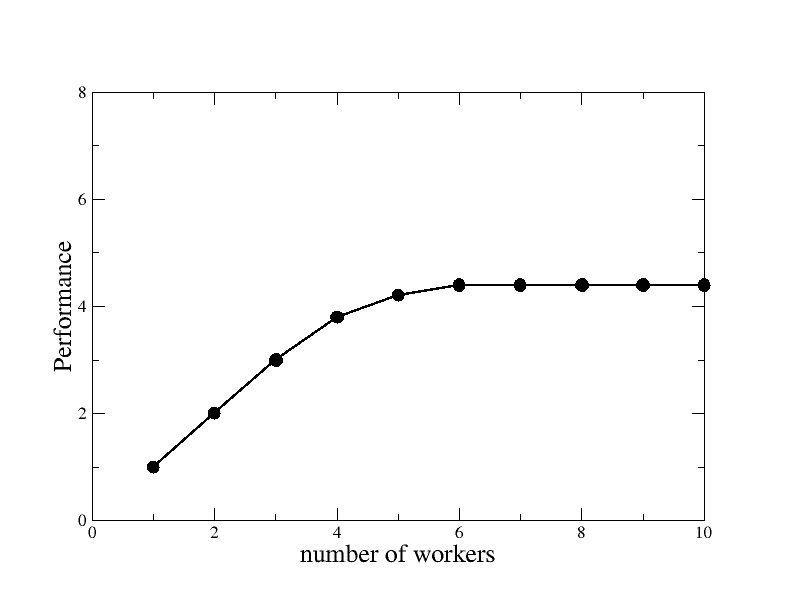
Saturating pattern
This pattern occurs if the performance of the code is limited by a shared resource, e.g. memory bandwidth. This is not necessarily bad. If memory bandwidth is the limiting resource of a code a saturating pattern indicates that the resource is addressed and the code operates at the resource limit. This should be confirmed by HPM measurements.
A saturating pattern might also occur in certain cases of load imbalance.
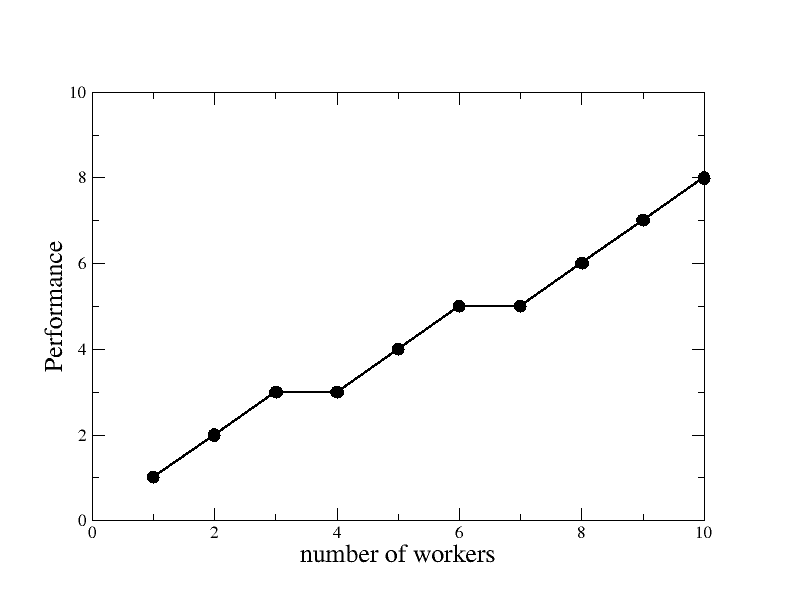
Load imbalance pattern
Load imbalance always causes additional waiting times. This may take the pattern of performance plateaus with worker counts were additional workers cannot be fully utilised.
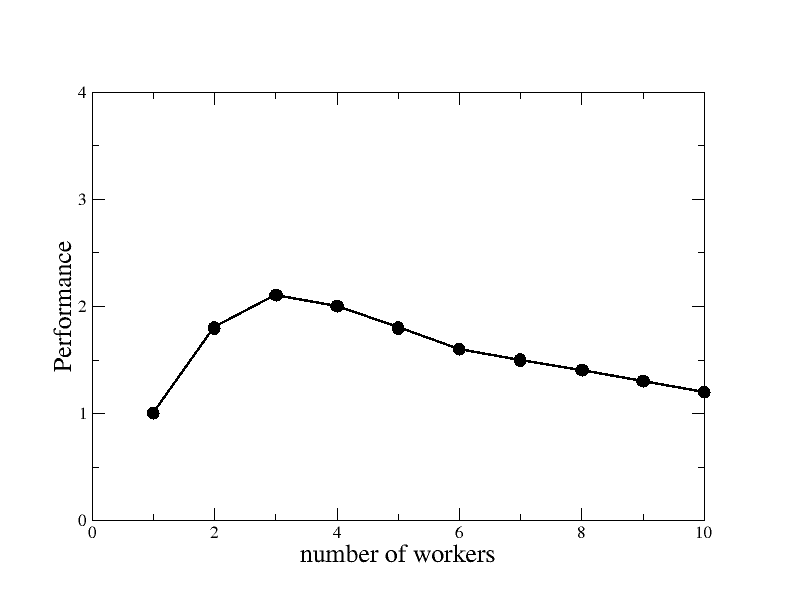
Overhead pattern
This is an extreme case of overhead, where with more workers the performance decreases. In real cases all patterns where either more workers give a worse performance or speedup decreases if adding more workers may be caused by various sources of overhead. Typically this is overhead introduced by the programming model, some pathological issue (e.g. false cacheline sharing) or work introduced by the parallelisation that does not scale.
Superlinear pattern
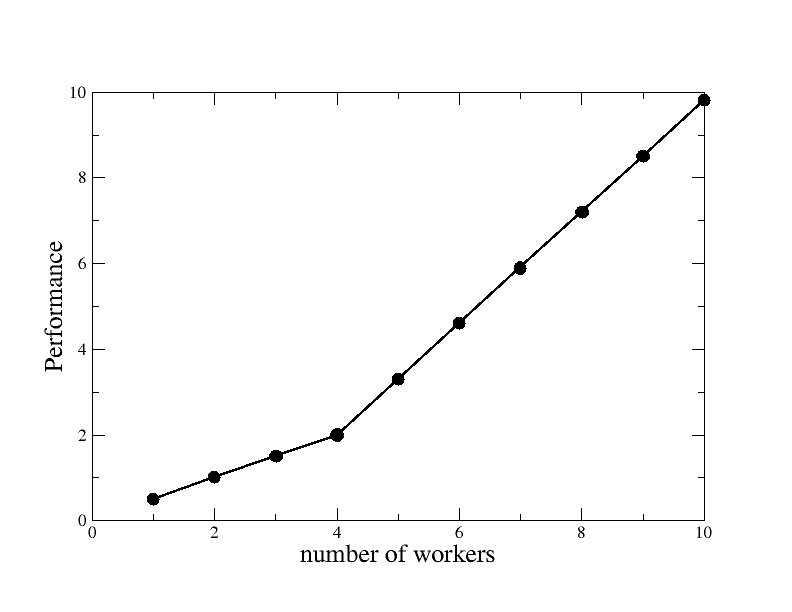
In some cases the performance suddenly shifts to a steeper slope when using more workers. A typical explanation for this phenomenon is that adding more workers also means adding more cache and a fixed size working set at some point fits into cache.


