Difference between revisions of "Intel VTune"
| Line 5: | Line 5: | ||
== Usage == | == Usage == | ||
| − | The following | + | The graphical interface of the Intel VTune Amplifier XE can usually be started by using the command <code>amplxe-gui</code>. The following analysis categories are available: |
| − | + | '''Hotspots''' | |
| − | |||
| − | |||
| − | |||
| − | |||
| − | + | Information on what parts of the code take up most of the runtime and how they may be optimized | |
| + | * Hotspots | ||
| + | * Memory Access | ||
| + | '''Microarchitecture''' | ||
| + | |||
| + | Information on how efficiently the code utilizes the underlying hardware | ||
| + | * Microarchitecture Exploration | ||
| + | * Memory Access | ||
| + | |||
| + | '''Parallelism''' | ||
| + | |||
| + | Information on how efficient the parallelization of the code is | ||
| + | * Threading | ||
| + | * HPC Performance Characterization | ||
| + | |||
| + | == Hotspot Analysis == | ||
| + | |||
| + | The following steps should be followed to analyze and optimize the code using the Hotspot Analysis: | ||
| + | |||
| + | 1. Preparing a VTune Amplifier Project | ||
| + | |||
| + | 2. Basic Hotspot Analysis | ||
| + | |||
| + | 3. Concurrency Analysis | ||
| + | |||
| + | 4. Locks and Waits Analysis | ||
| + | |||
| + | === Preparing a VTune Amplifier Project === | ||
| + | |||
| + | Build the application in the Release mode with full optimizations and run it multiple times to create a performance baseline (average runtime). Next, start the VTune Amplifier with <code>amplxe-gui</code> and create a new project. Specify and configure the target application by setting the executable and possible parameters. | ||
| + | |||
| + | === Basic Hotspot Analysis === | ||
| + | |||
| + | Select and run the basic Hotspot Analysis. Once the analysis has finished, the summary window should open automatically. If not, switch to it. | ||
[[File:Intel-VTune-Hotspot.png|500px]] | [[File:Intel-VTune-Hotspot.png|500px]] | ||
| − | + | Both the measured serial and parallel times are shown as well as an estimated ideal parallel time to give you an idea of how much improvement may be possible. Next, there should be a section listing the different [[OpenMP]] regions in your code and ranking them by improvement potential. | |
| − | + | The bottom-up window shows the most time-consuming functions, i.e. the hotspots of the code. Issues can be resolved by viewing and editing the actual code lines with the source editor. | |
It is important not to neglect the serial parts of a code, as these can seriously weigh down the performance of the application no matter how efficiently parallelised the rest may be. | It is important not to neglect the serial parts of a code, as these can seriously weigh down the performance of the application no matter how efficiently parallelised the rest may be. | ||
| − | == Concurrency Analysis == | + | === Concurrency Analysis === |
| + | === Locks and Waits Analysis === | ||
== References == | == References == | ||
Revision as of 13:42, 17 April 2019
The Intel VTune™ Amplifier can be used to identify and analyse various aspects in both serial and parallel programs and can be used for both OpenMP and MPI applications.
Usage
The graphical interface of the Intel VTune Amplifier XE can usually be started by using the command amplxe-gui. The following analysis categories are available:
Hotspots
Information on what parts of the code take up most of the runtime and how they may be optimized
- Hotspots
- Memory Access
Microarchitecture
Information on how efficiently the code utilizes the underlying hardware
- Microarchitecture Exploration
- Memory Access
Parallelism
Information on how efficient the parallelization of the code is
- Threading
- HPC Performance Characterization
Hotspot Analysis
The following steps should be followed to analyze and optimize the code using the Hotspot Analysis:
1. Preparing a VTune Amplifier Project
2. Basic Hotspot Analysis
3. Concurrency Analysis
4. Locks and Waits Analysis
Preparing a VTune Amplifier Project
Build the application in the Release mode with full optimizations and run it multiple times to create a performance baseline (average runtime). Next, start the VTune Amplifier with amplxe-gui and create a new project. Specify and configure the target application by setting the executable and possible parameters.
Basic Hotspot Analysis
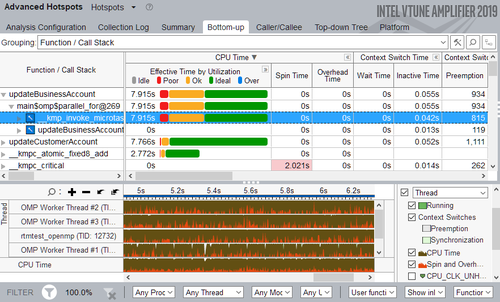
Select and run the basic Hotspot Analysis. Once the analysis has finished, the summary window should open automatically. If not, switch to it.
Both the measured serial and parallel times are shown as well as an estimated ideal parallel time to give you an idea of how much improvement may be possible. Next, there should be a section listing the different OpenMP regions in your code and ranking them by improvement potential. The bottom-up window shows the most time-consuming functions, i.e. the hotspots of the code. Issues can be resolved by viewing and editing the actual code lines with the source editor.
It is important not to neglect the serial parts of a code, as these can seriously weigh down the performance of the application no matter how efficiently parallelised the rest may be.
Concurrency Analysis
Locks and Waits Analysis
References
Tutorials by Intel [1]
Intel VTune™ Amplifier Performance Analysis Cookbook [2]
