Difference between revisions of "ProPE PE Process"
m |
|||
| Line 1: | Line 1: | ||
| + | [[HPC-Developer]] | ||
== Introduction == | == Introduction == | ||
Revision as of 10:26, 5 September 2019
Introduction
The performance engineering process presented here is a prescription, how to analyze and to tune performance of an application step by step. We assume, that the used algorithm in the analyzed application is already efficient enough for the to solved problem. However, some small algorithmic improving recommendations can be provided.
With this process the most significant performance problem of an application can be recognized. However, some problems can be identified only by experts. The results of below presented analysis will be then a good starting point for fast understanding of program performance.
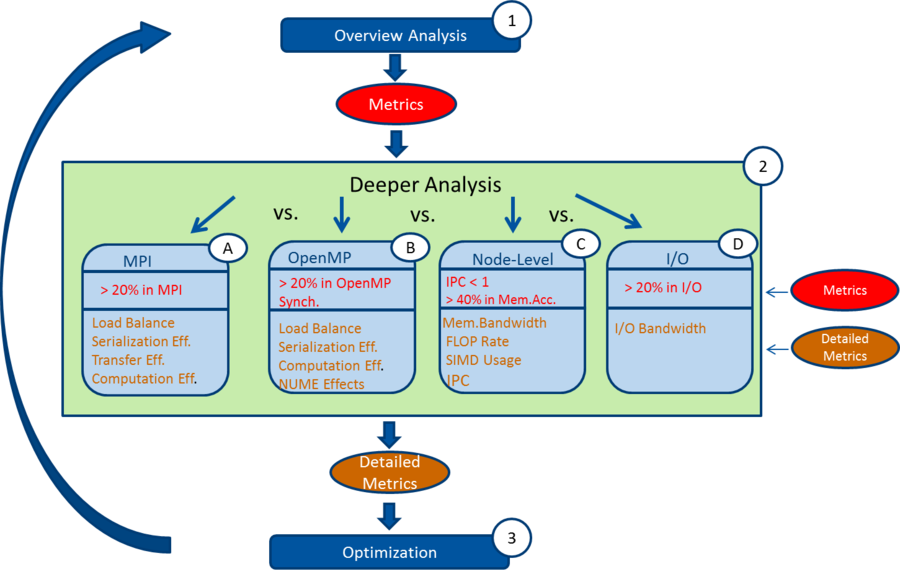
PE-Process Overview
Performance of an application is a combination of several aspects. For succesfully improving the application performance, all performance aspects should be analyzed and optimized, if needed.
We differentiate between four performance aspects:
A. MPI behavior: communication and synchronization among MPI processes on multiple compute nodes.
B. OpenMP behavior: behavior of OpenMP threads within one node.
C. Node-level performance of the user code: efficiency of the serial algorithm and hardware usage
D. Input/Output overhead: how dominant reading and writing of the data in the application is and how this impacts the full program performance
The PE process consists of three repetitive steps: overview analysis, detailed analysis of one of the performance aspects and optimization of this performance aspect. Each analysis delivers some metrics, based on which several performance issues can be recognized and optimized. If an optimization of one of the performance aspects was executed, the performance engineering process should be started from the beginning to focus on optimization of the next performance aspect, which is identified by the subsequent analysis.
Overview Analysis
At first we start with a rough overview of the application performance for all four aspects with light-weight analysis tools like Intel Application Performance Snapshot (free) or Arm Performance Reports (commercial). For both tools a new compilation and linking of the program or special settings of the tool are not needed. The tools give no detailed information about single functions, but provide concrete numbers, like time share spent in MPI operations, in OpenMP synchronization or number of executed instructions per cycle etc., with a threshold for each performance aspect. We call these numbers metrics. Thresholds for all metrics have been defined by experts from the corresponding HPC area or set by analysis tools. Based on each metric and its threshold it can be recognized, which aspect is a performance bottleneck for the application. This performance aspect should then be analyzed in detail and optimized at first in the next performance engineering steps.
Metrics and their thresholds:
A. If more than 20% of the CPU time is spent in MPI operations, the behavior of the MPI processes on several compute nodes should be analyzed deeper at first.
B. If more than 20% of the CPU time was spent in OpenMP synchronization, the behavior of OpenMP threads should be analyzed deeper as first.
C. If the number of executed instructions per cycle (IPC) is smaller as 1 or more than 40% of the CPU time is spent in memory accesses, the node-level performance of the code should be analyzed deeper.
D. If more than 20% of the time was spent in read and write operations, you should look deeper at the I/O behavior of the application.
Deeper Analysis
By the overview analysis a performance aspect is identified, that should be analyzed deeper. First, the application structure should be well understood by identifying the main temporal phases (initialization, iterative loop, etc.). Next, it would be good to focus the analysis on a selected region to avoid that the initialization phase perturbs the metrics for the execution in cases where only few iterations are executed. It is also helpful to understand the internal structure of the selected region (number of iterations, phases within the iteration, etc.). In a following analysis some detailed metrics should be calculated for the selected application region. For each performance aspect the detailed metrics are listed here. These metrics should be calculated to identify the performance issues. We call identified performance issues issue patterns. Patterns can be recognized by well-defined metrics and are listed below in step 3.Optimization for each performance aspect.
A. MPI behavior
To calculate detailed metrics for an application on MPI level a trace analysis should be run with analysis tools like Scalasca/Score-P/Cube/Vampir or Extrae/Paraver/Dimemas. To get a full overview of the application performance and a better understanding of the issues of a program on inter-node level, all the detailed metrics below have to be calculated and considered. Both tool groups Score-P and Extrae provide possibilities to get all needed detailed metrics. The links to documentations with detailed description of MPI metrics and how to calculate them with the tools you will find below under Useful Links.
The listed metrics serve to indicate the Parallel Efficiency of the application. In general, it is the average time outside of any MPI calls. In the following model the Parallel Efficiency is decomposed into three main factors: load balance, serialization/dependencies and transfer. The metrics are numbers normalized between 0 and 1 and can be represented as percentages.
For a successful trace analysis, a more or less realistic test case that does not take too long should be found for the application run. Our recommendation is a runtime of about 10-30 minutes. The second recommendation is not to use too many MPI processes for a trace analysis. If the program is running for a long time or is started with more than 100 processes the analysis tools create too much trace data and need too much time to visualize the results. Sometimes it can be useful to switch off writing of result data in the application to analyze pure parallel performance. However it can affect dependencies among processes and change waiting time of processes.
Detailed Metrics
- The Load Balance Efficiency (LB) reflects how well the distribution of work to processes is done in the application. We differ between Load Balance in time and in number of executed instructions. If processes spend different amounts of time in computations, you should look at how well executed instructions are distributed among processes. The Load Balance Efficiency is the ratio between the average time/instructions a process spends/executes in computation and the maximum time/instructions a process spends/executes in computation. The threshold is 85%. If the Load Balance Efficiency is smaller than 85% check the issue pattern Load Imbalance.
- The Serialization Efficiency (SE) describes loss of efficiency due to dependencies among processes. Dependencies can be observed as waiting time in MPI calls where no data is transferred, because at least one involved process did not arrive at the communication call yet. On an ideal network with instantaneous data transfer these inefficiencies are still present, as no real data transfer happens. The Serialization Efficiency is computed as the ratio between the maximum time a process spends in computation and the total runtime on ideal network (also called Critical Path). The threshold is 90%. If the Serialization Efficiency is smaller than 90% check the issue pattern Serialization.
- The Transfer Efficiency (TE) describes loss of efficiency due to actual data transfer.The Transfer Efficiency can be computed as the ratio between the total runtime on an ideal network (Critical Path) and the total measured runtime. The threshold is 90%. If the Transfer Efficiency is smaller than 90% the application is transfer-bound.
- The Serialization and Transfer Efficiencies can be combined into the Communication Efficiency (CommE), which reflects the loss of efficiency by communication. If creating the trace analysis of an application is not possible or the ideal network cannot be simulated, this metric can be used to understand how efficient the communication in an application is. If the Communication Efficiency is smaller than 80% the application is communication-bound.
- The Computation Efficiency (CompE) describes how well the computational load of an application scales with the number of processes. The Computation Efficiency is computed by comparing the total time spent in multiple program runs with a varying number of processes. For a linearly-scaling application the total time spend in computation is constant and thus the Computation Efficiency is one. The Computation Efficiency is the ratio between the accumulated computation time with a smaller number of processes and the accumulated computation time with a larger number of processes. The Computation Efficiency depends on the processes number ratio of two program executions. The threshold is 80% by four times more processes. In the case of low Computation Efficiency check at the issue pattern Bad Computational Scaling.
The Instruction Scaling (InsScal) is a metric, which can explain why the Computation Efficiency is low. Typically, with the more processes, the more instructions have to be executed, e.g. some extra computation for the domain decomposition is needed and these computations are executed redundantly by all processes. Instruction Scaling compares the total number of instructions executed for a different number processes. This is the ratio between the number of executed instructions by processes in computation with a smaller number of processes and the number of executed instructions with a larger number of processes. The threshold is 85% by four times more processes.
The second possible reason for low Computation Efficiency is bad IPC Scaling. In this case the same number of instructions is computed but the computation takes more time. This can happen e.g. due to shared resources like memory channels. IPC Scaling compares how many instructions per cycle are executed for a different number of processes. This is the ratio between the number of executed instructions per cycle in computation with a larger number of processes and the number of executed instructions per cycle with a smaller number of processes. The threshold is 85% by four times more processes.
Even if all efficiencies are good, it should be proved, if there are any MPI calls that achieve bad performance, if the application is sensitive to the network characteristics, if asynchronous communications may improve the performance, etc. The objective is to identify if the communications in the application should be improved.
Useful Links
- Detailed description of MPI Metrics: summarizing the POP Standard Metrics for Parallel Performance Analysis
- Tools: performance analysis tools for downloading
- Learning material: user guides and tutorials for the tools
- Exercises and solutions: how to create traces with Score-P/Cube/Scalasca or Extrae/Dimemas/Paraver and to calculate detailed metrics with them
B. OpenMP behavior
For a deeper analysis of an application on OpenMP level you can use the tools Intel VTune or LIKWID. The tools like Score-P and Extrae also partially support the analysis of some OpenMP applications. We recommend to analyze your application on only one compute node for a test case, which runs about 5-20 minutes.
Detailed Metrics:
- The Load Balance (LB) shows how well the work is distributed among the threads of the application. It is the ratio between average computation time and the maximum computation time of all threads. The computation time can be identified by analysis tools as the time spent in user code outside of any synchronisations like implicit or explicit barriers. The threshold is 85%.
- The Serialization Efficiency (SE) describes the loss of efficiency due to dependencies among threads and due to a lot of time spent in serial execution. The threshold is 80%.
- Alternatively to Serialization Efficiency the Effective Time Rate (ETR) can be calculated, if analyzed with Intel VTune. It describes the synchronization overhead in an application because of threads showing a long idle-time. This is the ratio between effective CPU time, accumulated time of threads outside OpenMP measured by Intel VTune, and total CPU time. Thus, Effective Time Rate is the percentage of the total CPU outside OpenMP. The threshold is 80%.
- The Computation Efficiency (CompE) reflects the loss of efficiency due to increasing the number of cores. To calculate the Computation Efficiency two application runs with a varying number of threads are compared. It is to identify if the application performance with a larger number of threads is getting worse. The threshold is 80% by four times more processes.
Advanced Detailed Metrics
If no issue pattern could be identified or for a better understanding of the application performance, some advanced metrics can be calculated.
- When using OpenMP tasks, the Task Overhead can be very high, if a lot of time is spent for task creation and task handling, e.g. when the number of tasks is too high or the work granularity is too low. The threshold is 5%. If Task Overhead is higher than 5%, but the load balance among threads is good, look at the issue pattern Task Overhead.
Tools to get the Metrics:
C. Node-level performance
A detailed analysis of node-level performance is only meaningful on a per-kernel base. This is especially true if the application consists of multiple kernels with very different behavior. Kernel in this context means a function or loop nest that pops up in a runtime profile. The metrics can be acquired with any Hardware performance counter profiling tool. Still because the performance groups we refer to are preconfigured in likwid-perfctr we recommend to start with this tool. For many metrics you also need the results of a microbenchmark. Details on how to measure these values will follow. Many metrics can only be acquired with a threaded or MPI parallel code but address performance issues related to single-node performance.
Detailed Metrics
- Memory bandwidth is the most severe shared resource bottleneck on the node level. To determine if an application is memory bandwidth bound the measured memory bandwidth is compared to the result of a microbenchmark. This metric is only useful if using all cores inside a memory domain as few cores cannot saturate the memory bandwidth. This metric is measured for a single memory domain. If the condition applies go on with Metrics below Case_1. If condition does not apply go on with metrics below Case_2. Threshold: >80% => memory bound.
Case 1 memory bound:
- Use of parallel memory interfaces characterizes if all parallel memory interfaces are utilized. Threshold: >80%.
Case 2 instruction throughput bound:
- Floating point operation rate. Floating point operations are a direct representation of algorithmic work in many scientific codes. A high floating point operation rate is therefore a high level indicator for the overall performance of the code. Threshold: >70%.
- SIMD usage. SIMD is a central technology on the ISA/hardware level to generate performance. Because it is an explicit feature, if and how efficiently it can be used depends on the algorithm. The metric characterizes the fraction of arithmetic instruction using the SIMD feature. **Caution:** SIMD also applies to loads and stores. Still the width of loads and stores cannot be measured with HPM profiling. Therefore this metric only captures a part of the SIMD usage ratio. Threshold: >70%.
- Instruction overhead. This metric characterizes the ratio of instructions that are not related to the useful work of the algorithm. This metric is only meaningful if arithmetic operations are related to this useful work of the algorithm. Overhead instructions may be added by the compiler (triggered by implementing programming language features or while performing transformations for SIMD vectorisation) or a runtime (e.g. spin waiting loops). Threshold: >40%.
- Execution Efficiency. Performance is defined by a) how many instructions I need to implement an algorithm and b) how efficient those instructions are executed by a processor. This metric quantifies the efficient use of instruction-level parallelism features of the processor as pipelining and superscalar execution. Threshold: CPI>60%.
D. Input/Output performance:
For a deeper analysis of I/O behavior you should look at the trace time line of the application, for example with the Vampir tool, to understand how Input/Output impacts the waiting time of processes and threads. Additionally there is the Darshan tool for a deeper analysis of HPC I/O characterization in an application and Intel Storage Performance Snapshot for a quick analysis of how efficiently a workload uses the available storage, CPU, memory, and network.
Detailed Metrics:
- I/O Bandwidth is calculated as the percentage of the measured I/O bandwidth of the application to the maximum possible I/O bandwith on the system. The threshold is 80%.
Optimization
By detailed analysis some performance issues in one of the performance aspects were identified. This performance aspect should now be optimized. There are Issues Patterns tables for the performance aspects with possibles reasons for the issues and possible solutions, how the problems can be solved. The tables cannot cover all possible issues in an application, however that is a good starting point for understanding application performance and for avoiding of some simple issues. For more advanced problems it can be helpful to let experts look at your code and at the already computed metrics. They can probably recognize what should be done next and how the identified problems are to optimize.
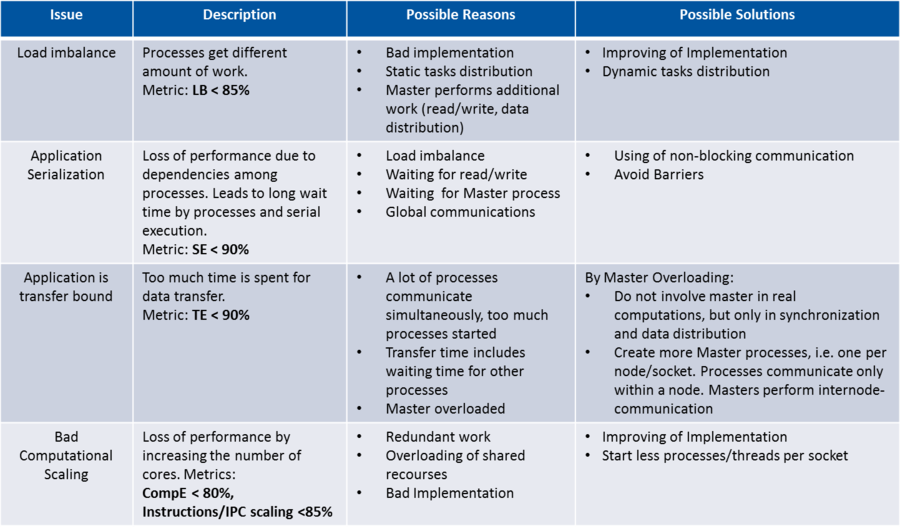
A. Issues Patterns on MPI Level
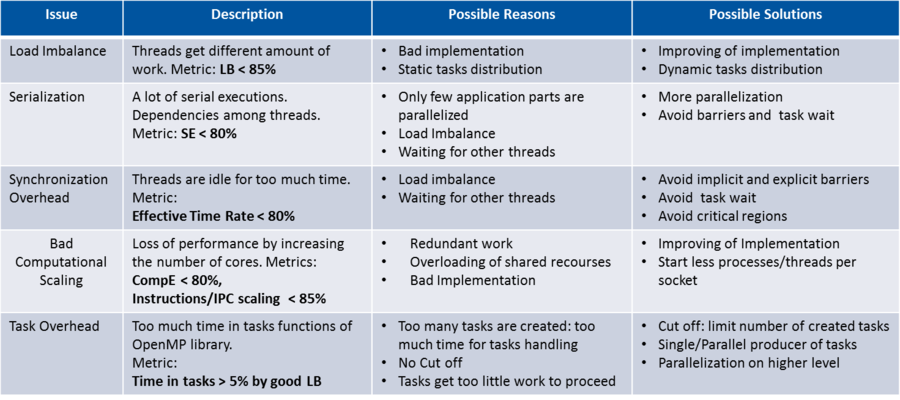
B. Issues Patterns for OpenMP Level
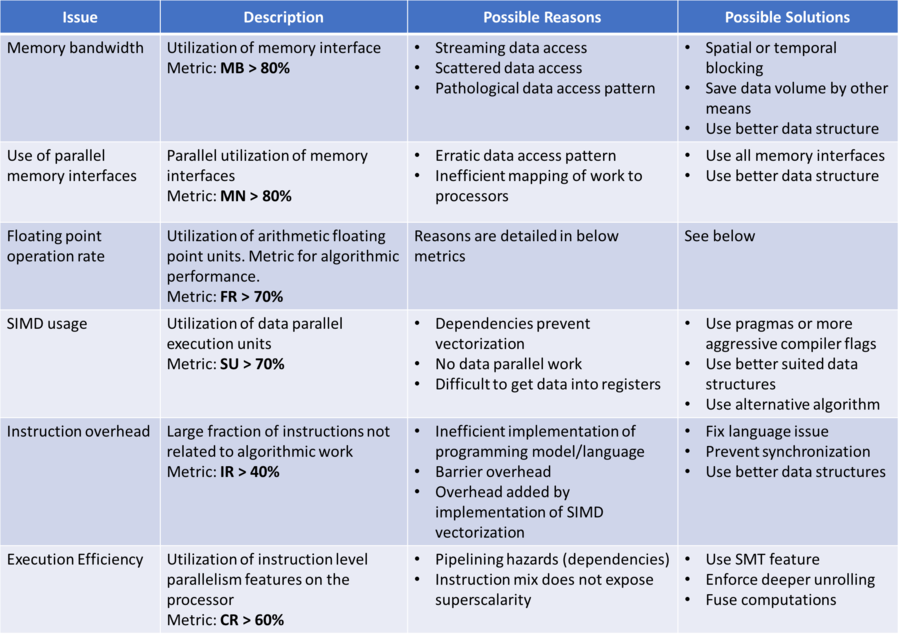
C. Issues Patterns for Node-level
D. I/O
Some small tips are shown here, how to reduce time spent in I/O:
- Minimize the number of check point outputs of results.
- Use special hardware for faster reading and writing with a higher I/O bandwidth.
- If the measured I/O bandwidth of the application is good, but a lot of time is nevertheless spent in reading and writing of data, it can be of advantage to write larger blocks of data instead of writing single bits of data.


