Difference between revisions of "Vampir"
| Line 9: | Line 9: | ||
Today, performance monitoring environments like Score-P, VampirTrace or TAU can produce trace files that are readable by Vampir. Vampir supports the new Open Trace Format 2 (OTF2) developed by a consortium of performance tool providers and the traditional Open Trace Format (OTF) that is developed by ZIH. Both formats have been specifically designed for performance data of massively parallel programs. OTF2 comes with the additional benefit of being an interchangeable cross-tool format. | Today, performance monitoring environments like Score-P, VampirTrace or TAU can produce trace files that are readable by Vampir. Vampir supports the new Open Trace Format 2 (OTF2) developed by a consortium of performance tool providers and the traditional Open Trace Format (OTF) that is developed by ZIH. Both formats have been specifically designed for performance data of massively parallel programs. OTF2 comes with the additional benefit of being an interchangeable cross-tool format. | ||
| + | |||
| + | |||
| + | == Site specific notes == | ||
| + | === TU Dresden === | ||
| + | In order to use Vampir on the Taurus cluster at TU Dresden you need to load the corresponding module. | ||
| + | <syntaxhighlight lang="sh"> | ||
| + | $ module add Vampir | ||
| + | </syntaxhighlight> | ||
| + | |||
| + | If you want to have an overview about all the available Vampir versions use the following command: | ||
| + | <syntaxhighlight lang="sh"> | ||
| + | $ module av Vampir | ||
| + | </syntaxhighlight> | ||
Revision as of 10:46, 7 October 2019
Vampir is a framework for performance analysis, which enables developers to quickly study program behavior at a fine level of detail. Performance data obtained from a parallel program run can be analyzed with a collection of specialized performance views. Intuitive navigation and zooming are the key features of the tool, which help to quickly identify inefficient or faulty parts of a program code.
An important and unique feature of Vampir is its intuitive and interactive graphical representation of detailed performance event recordings over time (timelines) and as aggregated profiles. Extensive searching and filtering capabilities allow to quickly identify critical bottlenecks. In contrast to traditional profiling the details that caused a problem remain close at hand. The performance charts include rich sets of performance information and can be customized to the needs of both beginners and experts.
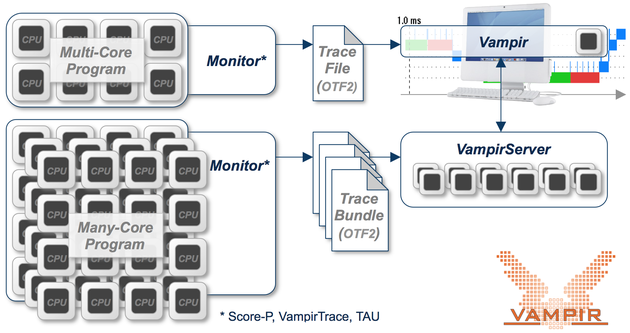
The scalable analysis backend VampirServer addresses very large performance analysis scenarios on supercomputers. Its objective is to outsource data intensive analysis operations from the Vampir user interface to powerful server hardware.
Today, performance monitoring environments like Score-P, VampirTrace or TAU can produce trace files that are readable by Vampir. Vampir supports the new Open Trace Format 2 (OTF2) developed by a consortium of performance tool providers and the traditional Open Trace Format (OTF) that is developed by ZIH. Both formats have been specifically designed for performance data of massively parallel programs. OTF2 comes with the additional benefit of being an interchangeable cross-tool format.
Site specific notes
TU Dresden
In order to use Vampir on the Taurus cluster at TU Dresden you need to load the corresponding module.
$ module add Vampir
If you want to have an overview about all the available Vampir versions use the following command:
$ module av Vampir
References
Product-related information [1]
Vampir Research at ZIH [2]
