File:Job efficiency load imbalance.png
Jump to navigation
Jump to search
Size of this preview: 800 × 176 pixels. Other resolutions: 320 × 70 pixels | 3,782 × 830 pixels.
Original file (3,782 × 830 pixels, file size: 378 KB, MIME type: image/png)
Summary
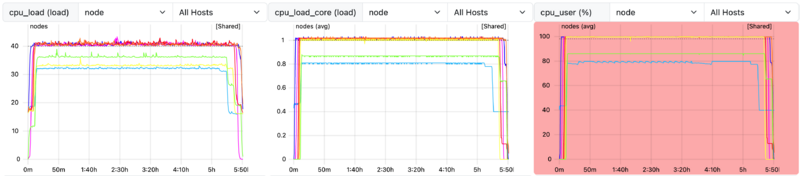
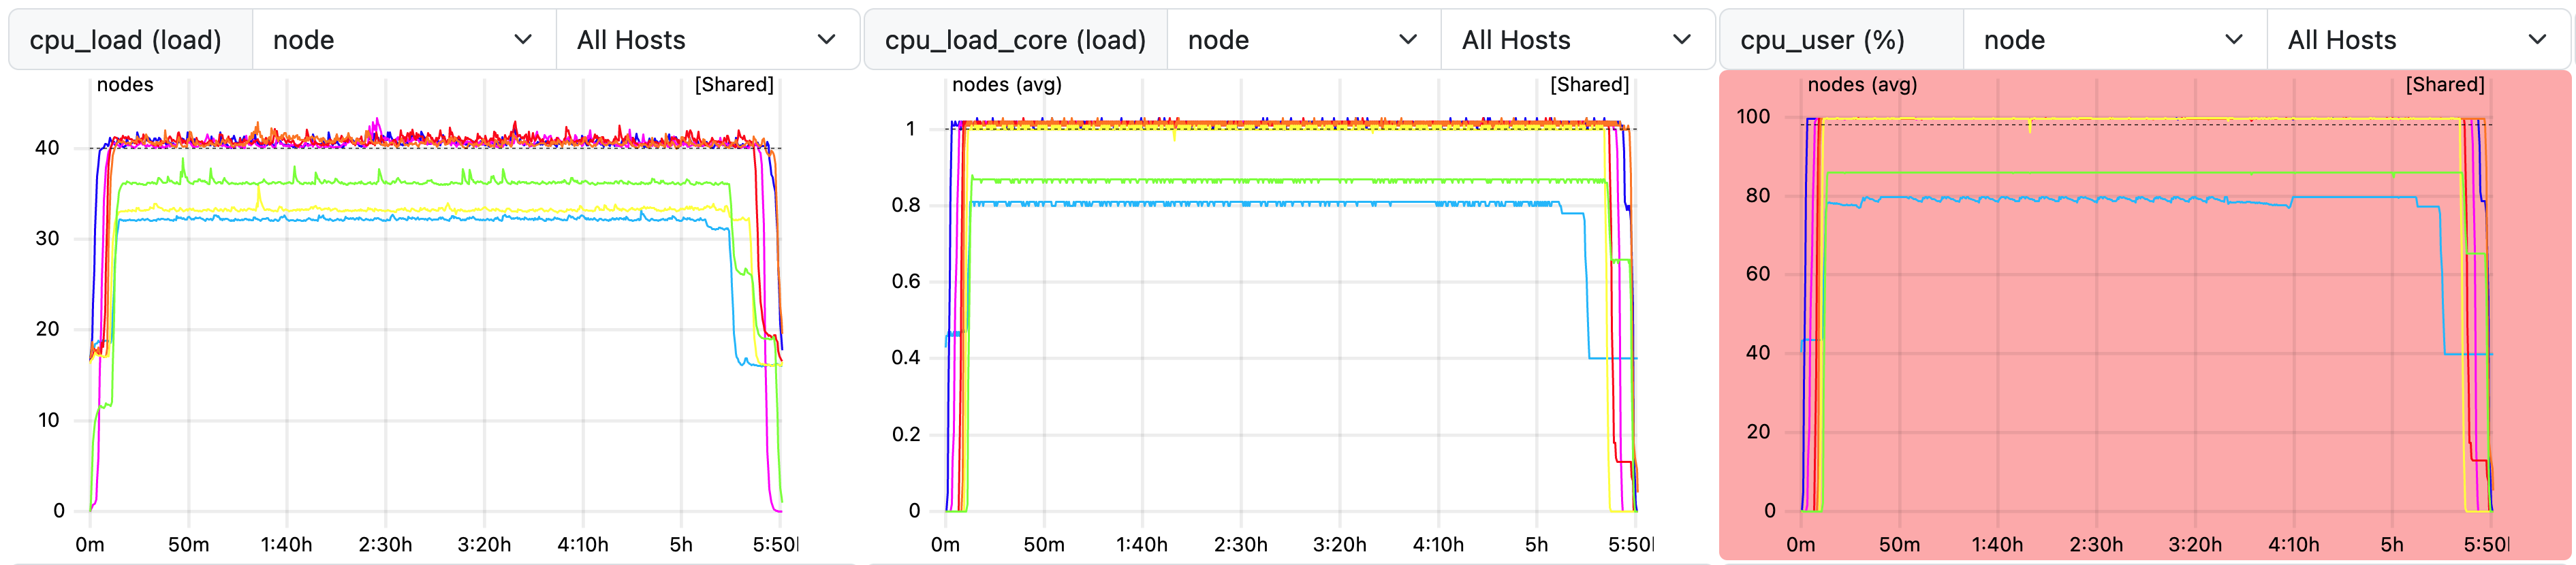
The figure shows ClusterCockpit measurements for a job that executes on multiple nodes in shared-mode. Three metrics are shown: node-level CPU load, averaged node-level CPU core load and averaged node-level CPU core time. While the CPU load metric may be influenced by other jobs running on the shared nodes, the CPU core load and CPU core time metrics use core-level measurements. These metrics show a difference in CPU utilization on different nodes.
File history
Click on a date/time to view the file as it appeared at that time.
| Date/Time | Thumbnail | Dimensions | User | Comment | |
|---|---|---|---|---|---|
| current | 18:15, 1 March 2024 | 3,782 × 830 (378 KB) | Alex-wiens-5f0c@uni-paderborn.de (talk | contribs) | The figure shows ClusterCockpit measurements for a job that executes on multiple nodes in shared-mode. Three metrics are shown: node-level CPU load, averaged node-level CPU core load and averaged node-level CPU core time. While the CPU load metric may be influenced by other jobs running on the shared nodes, the CPU core load and CPU core time metrics use core-level measurements. These metrics show a difference in CPU utilization on different nodes. |
You cannot overwrite this file.
File usage
The following page uses this file: