File:Job efficiency oversubscription.png
Jump to navigation
Jump to search

Size of this preview: 800 × 463 pixels. Other resolutions: 320 × 185 pixels | 1,193 × 691 pixels.
Original file (1,193 × 691 pixels, file size: 147 KB, MIME type: image/png)
Summary
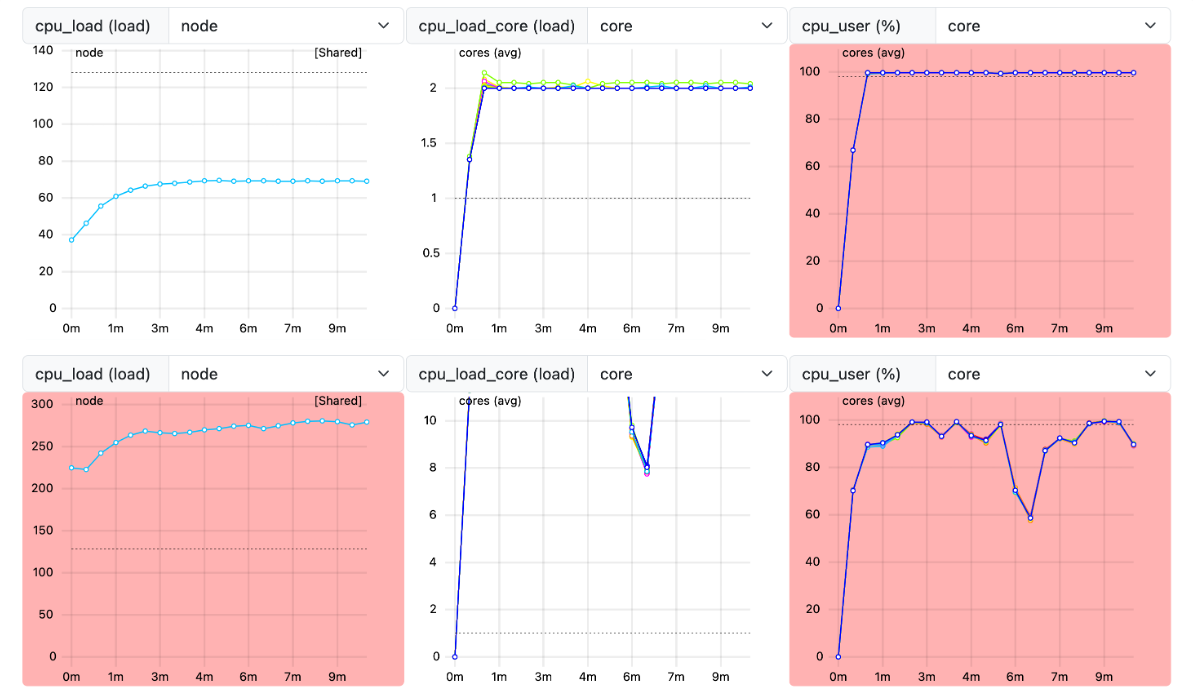
ClusterCockpit plots showing CPU load on the node- and core-level and CPU time metrics for two shared jobs running on 16 cores respectively. The top plots show measurements for a job with 2 threads per core. The bottom plots show measurements for a job with 16 threads per core.
File history
Click on a date/time to view the file as it appeared at that time.
| Date/Time | Thumbnail | Dimensions | User | Comment | |
|---|---|---|---|---|---|
| current | 17:54, 27 February 2024 | | 1,193 × 691 (147 KB) | Alex-wiens-5f0c@uni-paderborn.de (talk | contribs) | ClusterCockpit plots showing CPU load on the node- and core-level and CPU time metrics for two shared jobs running on 16 cores respectively. The top plots show measurements for a job with 2 threads per core. The bottom plots show measurements for a job with 16 threads per core. |
You cannot overwrite this file.
File usage
The following page uses this file: