File:Job efficiency scaling performance degradation.png
Jump to navigation
Jump to search
Size of this preview: 800 × 387 pixels. Other resolutions: 320 × 155 pixels | 4,294 × 2,076 pixels.
Original file (4,294 × 2,076 pixels, file size: 1.57 MB, MIME type: image/png)
Summary
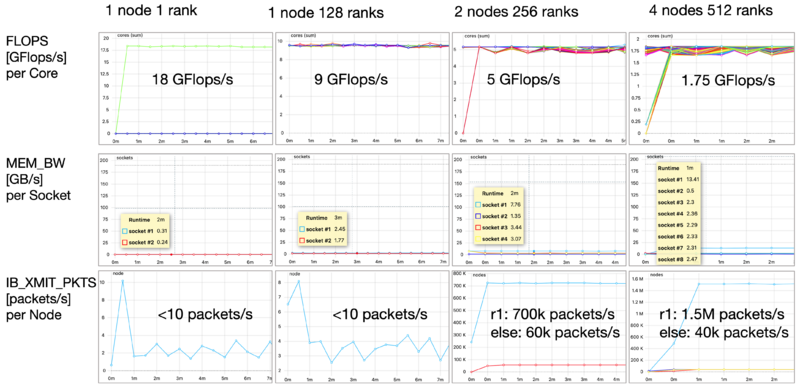
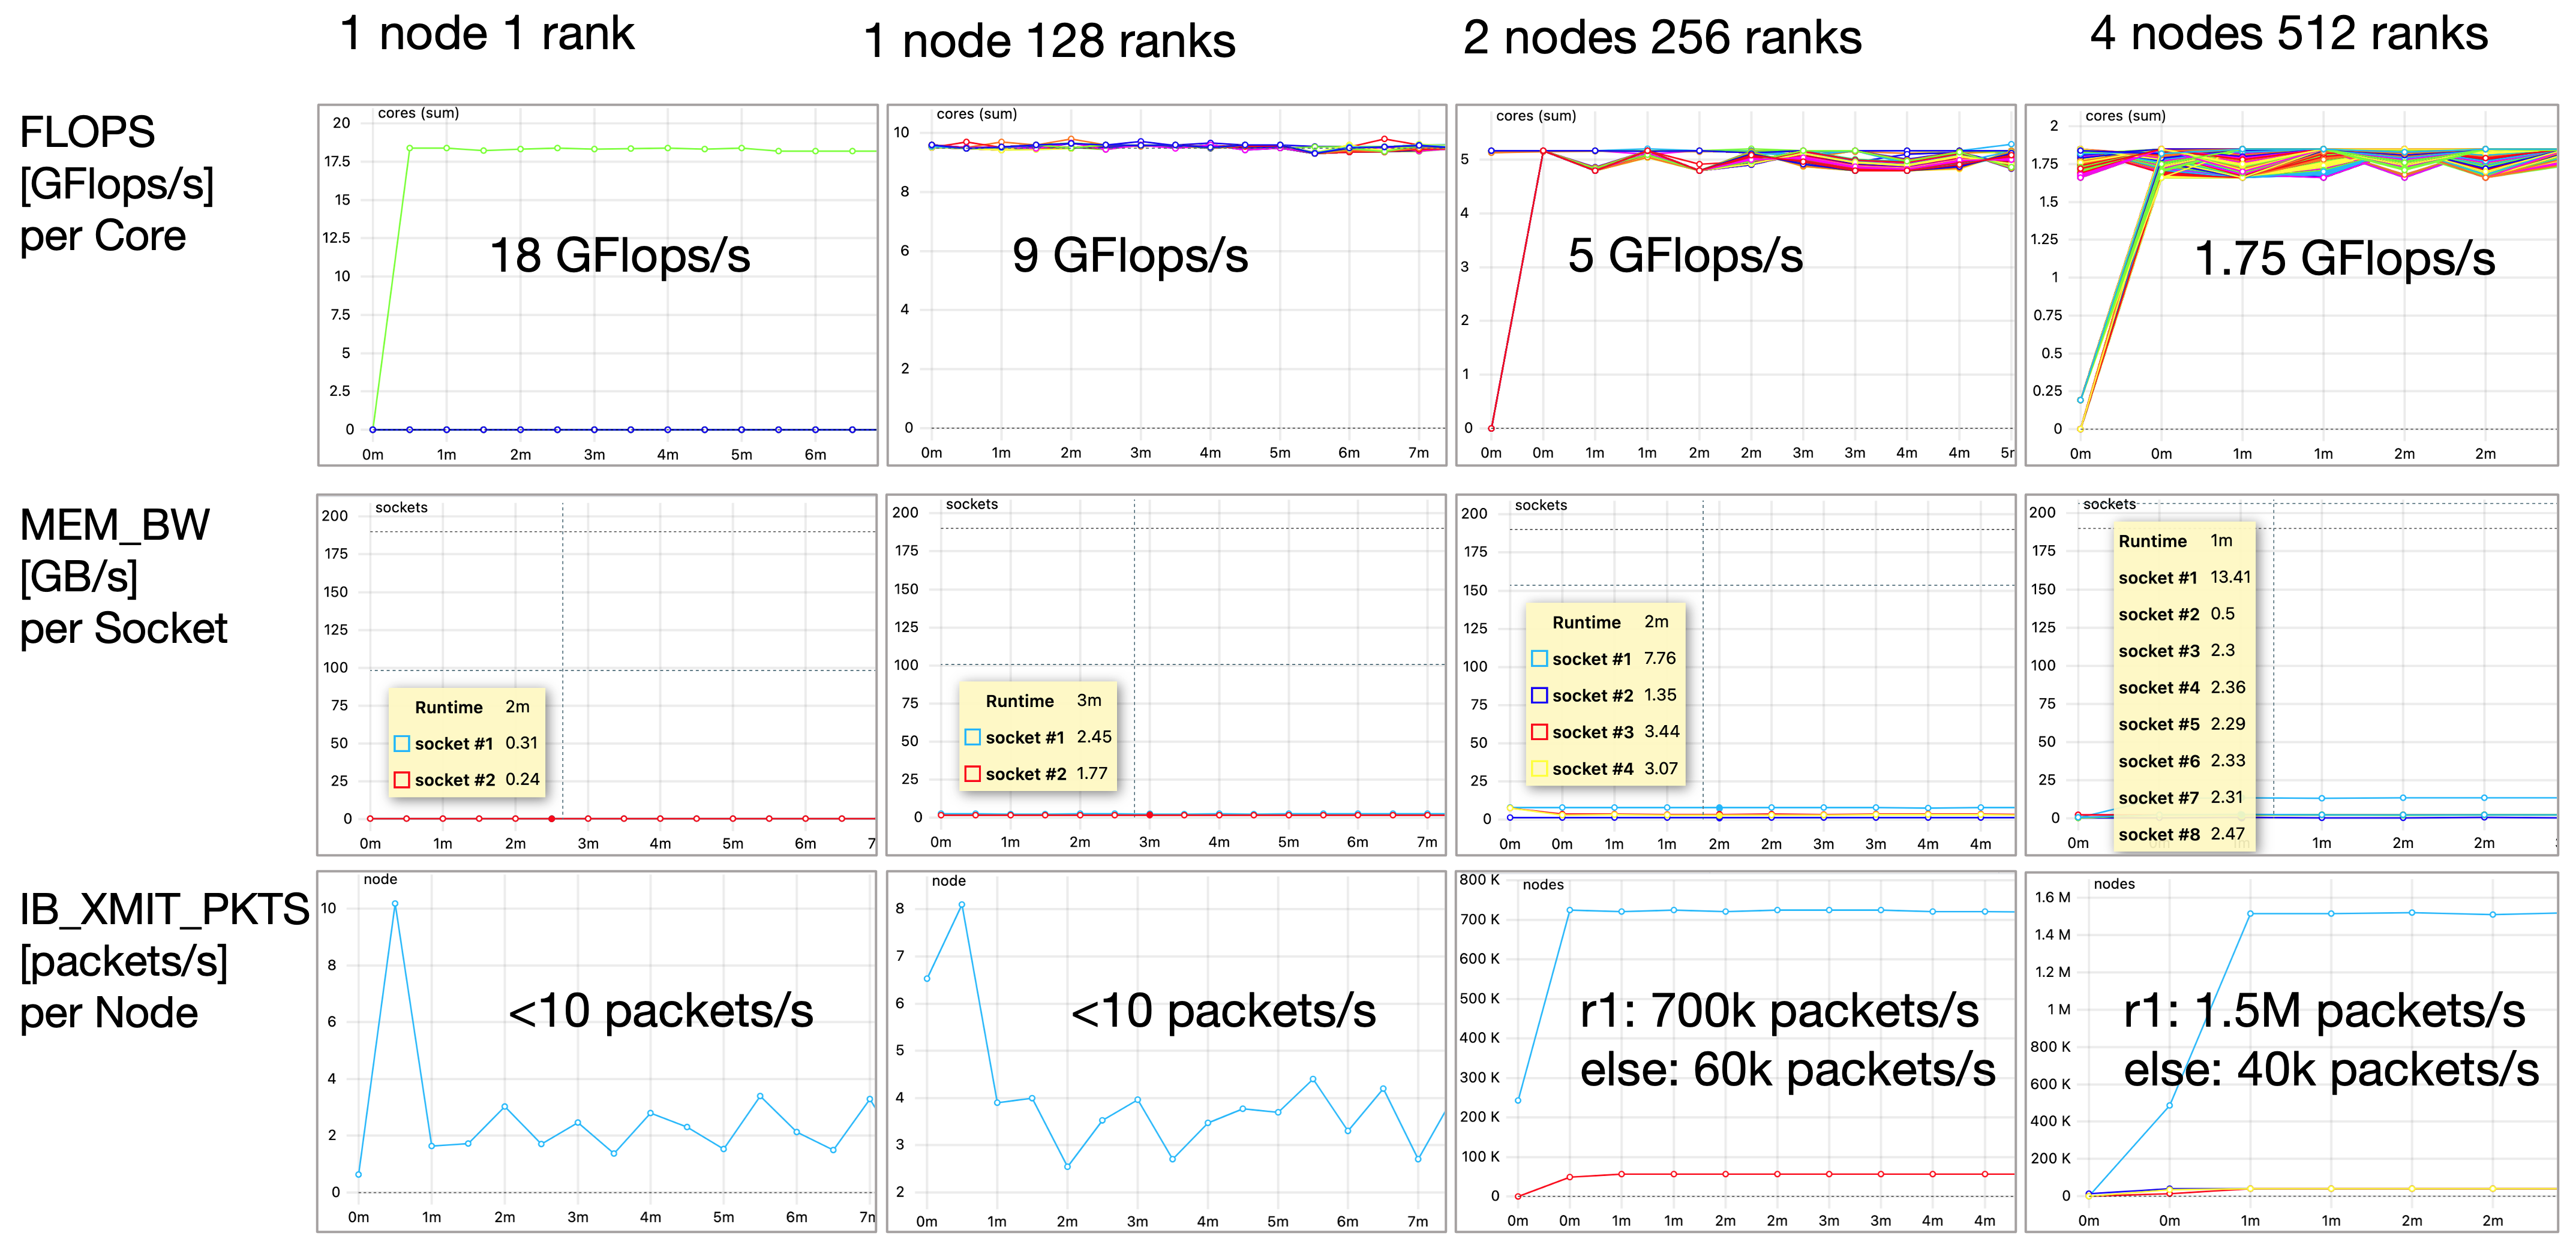
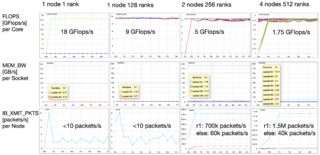
The image shows ClusterCockpit measurement results for an application that is executed with multiple scaling configurations. It is executed with four different configurations on 1 core, 128 cores (1 node), 256 cores (2 nodes) and 512 cores (4 nodes). Three metrics are show for every case: Flops per core, memory bandwidth per socket and transmitted network packets per node. The plots show how with increased number of involved cores and nodes the performance degrades and the communication overhead increases.
File history
Click on a date/time to view the file as it appeared at that time.
| Date/Time | Thumbnail | Dimensions | User | Comment | |
|---|---|---|---|---|---|
| current | 19:24, 28 February 2024 | | 4,294 × 2,076 (1.57 MB) | Alex-wiens-5f0c@uni-paderborn.de (talk | contribs) | The image shows ClusterCockpit measurement results for an application that is executed with multiple scaling configurations. It is executed with four different configurations on 1 core, 128 cores (1 node), 256 cores (2 nodes) and 512 cores (4 nodes). Three metrics are show for every case: Flops per core, memory bandwidth per socket and transmitted network packets per node. The plots show how with increased number of involved cores and nodes the performance degrades and the communication overh... |
You cannot overwrite this file.
File usage
The following page uses this file: