Difference between revisions of "Intel VTune"
| (14 intermediate revisions by 3 users not shown) | |||
| Line 1: | Line 1: | ||
| − | The Intel VTune™ Amplifier can be used to identify and analyse various aspects in both serial and parallel programs and can be used for both [[OpenMP]] and [[MPI]] applications. | + | [[Category:HPC-Developer]] |
| + | [[Category:Benchmarking]]<nowiki /> | ||
| + | The Intel VTune™ Profiler (prior version 2020: Amplifier XE) can be used to identify and analyse various aspects in both serial and parallel programs and can be used for both [[OpenMP]] and [[MPI]] applications. It can be used with a command line interface (CLI) or a graphical user interface (GUI). | ||
__TOC__ | __TOC__ | ||
| − | == | + | == Overwiew == |
| − | The following | + | The graphical interface of the Intel VTune Profiler can usually be started by using the command <code>vtune-gui</code>. The following analysis categories are available: |
| − | + | '''Hotspots''' | |
| − | |||
| − | |||
| − | |||
| − | |||
| + | Information on what parts of the code take up most of the runtime and how they may be optimized | ||
| + | * Hotspots | ||
| + | * Memory Access | ||
| + | |||
| + | '''Microarchitecture''' | ||
| + | |||
| + | Information on how efficiently the code utilizes the underlying hardware | ||
| + | * Microarchitecture Exploration | ||
| + | * Memory Access | ||
| + | |||
| + | '''Parallelism''' | ||
| + | |||
| + | Information on how efficient the parallelization of the code is | ||
| + | * Threading | ||
| + | * HPC Performance Characterization | ||
| + | |||
| + | '''Platform Analysis''' | ||
| + | |||
| + | Various options to analyze GPU usage, I/O and the platform in general | ||
| + | * System Overview | ||
| + | * GPU Compute/Media Hotspots (preview) | ||
| + | * GPU Rendering (preview) | ||
| + | * Input and Output | ||
| + | * CPU/FPGA Interaction (preview) | ||
| + | * GPU Offload (preview) | ||
| + | * Throttling (preview) | ||
| + | * Platform Profiler | ||
| + | |||
| + | |||
| + | '''Custom Analysis''' | ||
| + | is the way of go if you are interested in very special view to your application. | ||
| + | |||
| + | |||
| + | |||
| + | |||
| + | == Using the Graphical User Interface (GUI) == | ||
=== Hotspot Analysis === | === Hotspot Analysis === | ||
| + | The Hotspot Analysis is the most commonly used analysis and generally the first approach to optimizing an application. It is also the default analysis set when starting '''Configure Analysis'''. In order to run it a script or executable must be set as well as necessary parameters and environment variables. Click the start button to start the analysis. Try to keep the amount of other software running on the same machine to a minimum to achieve accurate and reproducable results. Once the analysis has finished, the '''Summary''' window should open automatically. | ||
| + | |||
| + | |||
| + | [[File:Intel-VTune-Hotspot-Summary.png|500px]] | ||
| + | |||
| + | The Elapsed Time shows the total runtime of the application including idle times while CPU Time is the sum of the CPU times of all threads. The Paused time is the total time the application was paused using the GUI, CLI commands or user API. The Top Hotspots section shows the most time-consuming functions sorted by CPU time. Below these one can find a histogram displaying the effective CPU Utilization of the application. | ||
| + | |||
| + | |||
| + | [[File:Intel-VTune-Hotspot-Bottom-up.png|500px]] | ||
| + | |||
| + | |||
| + | In the '''Bottom-up''' window one can find detailed information grouped by function and again sorted by CPU time. Functions with high CPU time and large sections of poor CPU utilization should be targeted first. When selecting a function the full stack data will be displayed in the Call Stack section with the following format: | ||
| + | |||
| + | <code><module>!<function>-<file>:<line></code> (the line being the one calling the next function) | ||
| + | |||
| + | |||
| + | [[File:Intel-VTune-Hotspot-Thread.png|500px]] | ||
| + | |||
| + | |||
| + | To analyse the performance per thread the grouping level can be switched to <code>Thread/Function/Call Stack</code>. Furthermore, the timeline below displays the behaviour of each thread during execution. Hovering over the '''Timeline''' itself will show the elapsed time until that point. The '''Threads''' section shows the CPU utilization per thread, while the '''CPU Utilization section''' shows the overall CPU utilization of the application. | ||
| + | |||
| + | |||
| + | [[File:Intel-VTune-Hotspot-Source.png|500px]] | ||
| + | |||
| + | |||
| + | Clicking on a function in the '''Bottom-up''' window (grouped by <code>Thread/Function/Call Stack</code>) will open the source editor at the respective code line. The Assembly window can be opened instead of or additionally to the Source window by ticking the respective boxes in the toolbar. The columns can be reorganized by drag-and-drop and the changes will be saved and used in other projects. | ||
| + | |||
| + | === Microarchitecture Exploration === | ||
| + | |||
| + | The Microarchitecture Exploration analysis is usually run after the hotspot analysis to find inefficiencies in CPU usage. It must be selected and configured manually in the configure analysis window. Remember to choose a sensible sampling rate and to have enough memory space available. Please also note that the default data collection limit of 1GB may well be exceeded quickly by this type of analysis and may need adjustment. | ||
| + | |||
| + | |||
| + | [[File:Intel-VTune-Analysis-Configuration.png|200px]] | ||
| + | |||
| + | |||
| + | Once the analysis has finished, the summary window should open by default. Here you should find a number of metrics listed hierarchially depending on the provided hardware. These event-based metrics are defined by Intel as well as thresholds indicating there might be an potential performance problem if surpassed, which will be marked by a red flag. | ||
| + | |||
| + | |||
| + | [[File:Intel-VTune-Microarchitecture-Summary.png|500px]] | ||
| + | |||
| + | |||
| + | Underneath there should be a so called '''µPipe''' diagram which shows a graphical representation of the CPU efficiency. | ||
| + | |||
| + | |||
| + | [[File:Intel-VTune-µpipe.png|500px]] | ||
| + | |||
| + | |||
| + | The '''Bottom-up''' window shows the individual functions of the application with the respective event-based metrics in descending order. Clicking on a function should again open the '''source''' window and show the respective lines of codes with the potential problems. On the right side there should also be a metrics tree if enough samples were collected. Underneath a timeline section can be found similarly to the one from the Hotspot analysis. | ||
| + | |||
| + | |||
| + | [[File:Intel-VTune-Microarchitecture-bottom-up.png|500px]] | ||
| + | |||
| + | == Using the Command Line Interface (CLI) == | ||
| + | |||
| + | The Intel VTune Command line interface (CLI) can be started by using the command <code>vtune</code> with the following parameters: | ||
| − | [[ | + | {| class="wikitable" style="width: 50%;" |
| + | | '''parameters''' || | ||
| + | |- | ||
| + | | <code><-action></code> || usually <code>collect</code> or <code>report</code> | ||
| + | |- | ||
| + | | <code>[-action-option]</code> || modify an actions behavior | ||
| + | |- | ||
| + | | <code>[-global-option]</code> || modify the global settings | ||
| + | |- | ||
| + | | <code><target></code> || set the target application | ||
| + | |- | ||
| + | | <code>[target-options]</code> || additional parameters or input required by the target application | ||
| + | |} | ||
| + | === action: collect === | ||
| − | + | Syntax: <code>vtune -collect <analysis_type></code> (-collect may be shortened to -c) | |
| − | + | The following analysis types are a selection that is of most interest for HPC applications. The full list can be found in the official Intel VTune Profiler User Guide, or type | |
| + | <code>$ vtune -help collect | less</code> | ||
| − | == | + | {| class="wikitable" style="width: 75%;" |
| + | | ''' analysis types ''' || | ||
| + | |- | ||
| + | | <code>hotspots</code> || Identify the most time consuming functions and lines of source code. | ||
| + | |- | ||
| + | | <code>hpc-performance</code> || Analyze important aspects of your application performance, including CPU utilization with details on OpenMP efficiency analysis, memory access, and vectorization information. | ||
| + | |- | ||
| + | | <code>memory-access</code> || Measure a set of metrics to identify memory access related issues. | ||
| + | |} | ||
| + | Additionally, there is a large number of global modifiers available of which a small selection can be found below aswell. | ||
| + | |||
| + | {| class="wikitable" style="width: 50%;" | ||
| + | | '''global modifiers'''|| | ||
| + | |- | ||
| + | | <code>-[no]auto-finalize</code> || [do not] finalize the result after collection | ||
| + | |- | ||
| + | | <code>-data-limit</code> || limit the amount of data that may be collected (defualt 1GB) | ||
| + | |- | ||
| + | | <code>-quiet</code> || display less information | ||
| + | |- | ||
| + | | <code>-search-dir</code> || set the path where the binary and symbol files are stored | ||
| + | |- | ||
| + | | <code>-result-dir</code> || set the path where the result should be stored | ||
| + | |} | ||
| + | |||
| + | |||
| + | '''Example:''' | ||
| + | |||
| + | Running <code>vtune -collect hotspots <target></code> with no further options set results in the following output. Similarly to the GUI output one receives the overall elapsed and idle times as well as the CPU times of the individual functions in descending order (list of hotspots). The utilization of the CPUs is also analyzed and judged. | ||
| + | |||
| + | |||
| + | [[File:Intel-VTune-CLI-Hotspot.png|500px]] | ||
| + | |||
| + | === action: report === | ||
| + | |||
| + | Syntax: <code>vtune -report <report_type> [-report-option]</code> (-report may be shortened to -r) | ||
| + | |||
| + | The report types and options which are of most interest for HPC applications are: | ||
| + | |||
| + | {| class="wikitable" style="width: 50%;" | ||
| + | | '''report types''' || | ||
| + | |- | ||
| + | | <code>summary</code> || Identify hotspots and collect stacks and call tree information | ||
| + | |- | ||
| + | | <code>hotspots</code> ||Identify hotspots by using hardware counters and ignore stack and call tree | ||
| + | |- | ||
| + | | <code>hw-events</code> || find low-level hardware issues | ||
| + | |} | ||
| + | |||
| + | {| class="wikitable" style="width: 50%;" | ||
| + | | '''report options'''|| | ||
| + | |- | ||
| + | | <code>-column</code> || Include or exclude columns | ||
| + | |- | ||
| + | | <code>filter</code> || Include or exclude data | ||
| + | |- | ||
| + | | <code>group-by</code> || specify grouping | ||
| + | |- | ||
| + | | <code>time-filter</code> || specify a time range | ||
| + | |- | ||
| + | | <code>-source-search-dir</code> || set the path where the source code is stored | ||
| + | |- | ||
| + | | <code>-result-dir</code> || set the path where the result should be stored | ||
| + | |} | ||
| + | |||
| + | |||
| + | '''Example:''' | ||
| + | |||
| + | First, run a hotspot collection and store the results in a directory (<code>vtune -collect hotspots -r result <target></code>) | ||
| + | |||
| + | Next, run <code>vtune -report hotspots -r result</code> to receive a report which contains only the data of interest (set by the report-options), e.g. only specific columns like CPU time. | ||
== References == | == References == | ||
| − | Tutorials by Intel [https://software.intel.com/en-us/articles/intel-vtune-amplifier-tutorials] | + | * Tutorials by Intel [https://software.intel.com/en-us/articles/intel-vtune-amplifier-tutorials] |
| − | + | * Intel VTune™ Profiler Performance Analysis Cookbook [https://software.intel.com/content/www/us/en/develop/tools/vtune-profiler/documentation.html] | |
| − | Intel VTune™ | ||
Latest revision as of 12:08, 19 July 2024
The Intel VTune™ Profiler (prior version 2020: Amplifier XE) can be used to identify and analyse various aspects in both serial and parallel programs and can be used for both OpenMP and MPI applications. It can be used with a command line interface (CLI) or a graphical user interface (GUI).
Overwiew
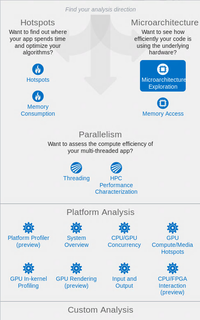
The graphical interface of the Intel VTune Profiler can usually be started by using the command vtune-gui. The following analysis categories are available:
Hotspots
Information on what parts of the code take up most of the runtime and how they may be optimized
- Hotspots
- Memory Access
Microarchitecture
Information on how efficiently the code utilizes the underlying hardware
- Microarchitecture Exploration
- Memory Access
Parallelism
Information on how efficient the parallelization of the code is
- Threading
- HPC Performance Characterization
Platform Analysis
Various options to analyze GPU usage, I/O and the platform in general
- System Overview
- GPU Compute/Media Hotspots (preview)
- GPU Rendering (preview)
- Input and Output
- CPU/FPGA Interaction (preview)
- GPU Offload (preview)
- Throttling (preview)
- Platform Profiler
Custom Analysis
is the way of go if you are interested in very special view to your application.
Using the Graphical User Interface (GUI)
Hotspot Analysis
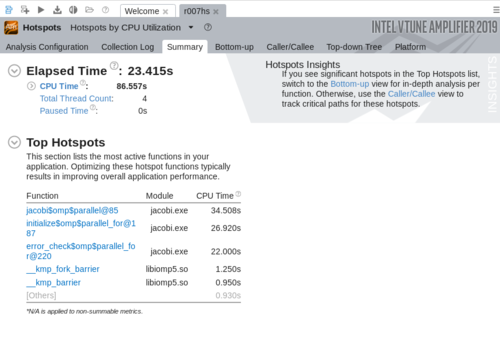
The Hotspot Analysis is the most commonly used analysis and generally the first approach to optimizing an application. It is also the default analysis set when starting Configure Analysis. In order to run it a script or executable must be set as well as necessary parameters and environment variables. Click the start button to start the analysis. Try to keep the amount of other software running on the same machine to a minimum to achieve accurate and reproducable results. Once the analysis has finished, the Summary window should open automatically.
The Elapsed Time shows the total runtime of the application including idle times while CPU Time is the sum of the CPU times of all threads. The Paused time is the total time the application was paused using the GUI, CLI commands or user API. The Top Hotspots section shows the most time-consuming functions sorted by CPU time. Below these one can find a histogram displaying the effective CPU Utilization of the application.
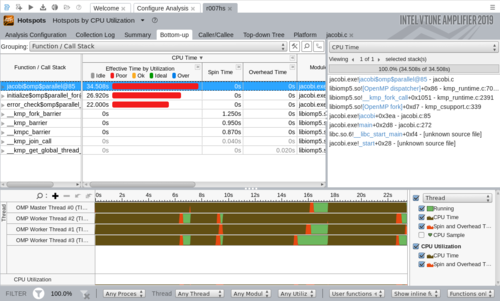
In the Bottom-up window one can find detailed information grouped by function and again sorted by CPU time. Functions with high CPU time and large sections of poor CPU utilization should be targeted first. When selecting a function the full stack data will be displayed in the Call Stack section with the following format:
<module>!<function>-<file>:<line> (the line being the one calling the next function)
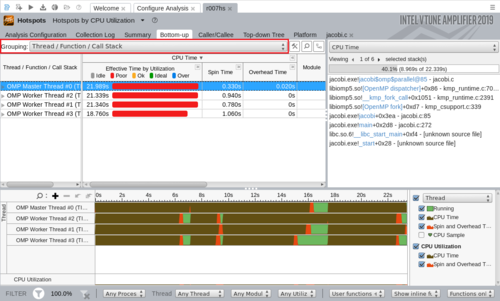
To analyse the performance per thread the grouping level can be switched to Thread/Function/Call Stack. Furthermore, the timeline below displays the behaviour of each thread during execution. Hovering over the Timeline itself will show the elapsed time until that point. The Threads section shows the CPU utilization per thread, while the CPU Utilization section shows the overall CPU utilization of the application.
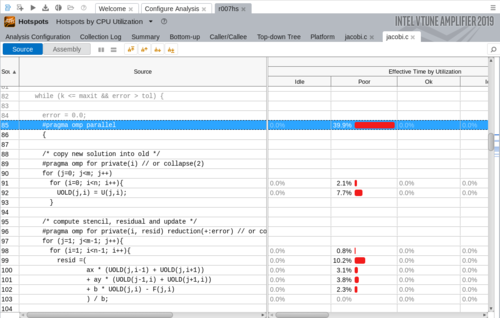
Clicking on a function in the Bottom-up window (grouped by Thread/Function/Call Stack) will open the source editor at the respective code line. The Assembly window can be opened instead of or additionally to the Source window by ticking the respective boxes in the toolbar. The columns can be reorganized by drag-and-drop and the changes will be saved and used in other projects.
Microarchitecture Exploration
The Microarchitecture Exploration analysis is usually run after the hotspot analysis to find inefficiencies in CPU usage. It must be selected and configured manually in the configure analysis window. Remember to choose a sensible sampling rate and to have enough memory space available. Please also note that the default data collection limit of 1GB may well be exceeded quickly by this type of analysis and may need adjustment.
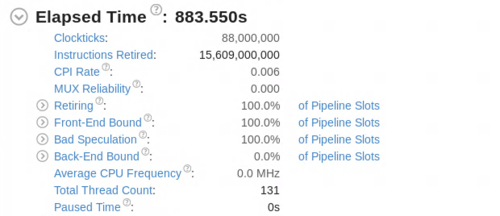
Once the analysis has finished, the summary window should open by default. Here you should find a number of metrics listed hierarchially depending on the provided hardware. These event-based metrics are defined by Intel as well as thresholds indicating there might be an potential performance problem if surpassed, which will be marked by a red flag.
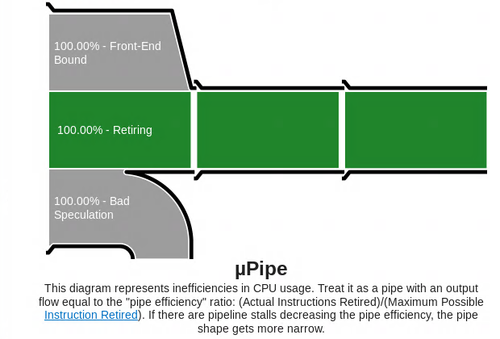
Underneath there should be a so called µPipe diagram which shows a graphical representation of the CPU efficiency.
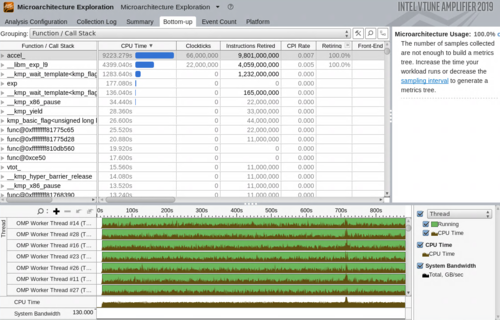
The Bottom-up window shows the individual functions of the application with the respective event-based metrics in descending order. Clicking on a function should again open the source window and show the respective lines of codes with the potential problems. On the right side there should also be a metrics tree if enough samples were collected. Underneath a timeline section can be found similarly to the one from the Hotspot analysis.
Using the Command Line Interface (CLI)
The Intel VTune Command line interface (CLI) can be started by using the command vtune with the following parameters:
| parameters | |
<-action> |
usually collect or report
|
[-action-option] |
modify an actions behavior |
[-global-option] |
modify the global settings |
<target> |
set the target application |
[target-options] |
additional parameters or input required by the target application |
action: collect
Syntax: vtune -collect <analysis_type> (-collect may be shortened to -c)
The following analysis types are a selection that is of most interest for HPC applications. The full list can be found in the official Intel VTune Profiler User Guide, or type
$ vtune -help collect | less
| analysis types | |
hotspots |
Identify the most time consuming functions and lines of source code. |
hpc-performance |
Analyze important aspects of your application performance, including CPU utilization with details on OpenMP efficiency analysis, memory access, and vectorization information. |
memory-access |
Measure a set of metrics to identify memory access related issues. |
Additionally, there is a large number of global modifiers available of which a small selection can be found below aswell.
| global modifiers | |
-[no]auto-finalize |
[do not] finalize the result after collection |
-data-limit |
limit the amount of data that may be collected (defualt 1GB) |
-quiet |
display less information |
-search-dir |
set the path where the binary and symbol files are stored |
-result-dir |
set the path where the result should be stored |
Example:
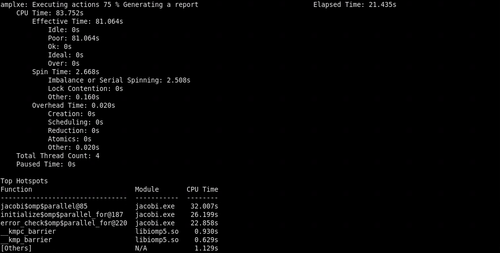
Running vtune -collect hotspots <target> with no further options set results in the following output. Similarly to the GUI output one receives the overall elapsed and idle times as well as the CPU times of the individual functions in descending order (list of hotspots). The utilization of the CPUs is also analyzed and judged.
action: report
Syntax: vtune -report <report_type> [-report-option] (-report may be shortened to -r)
The report types and options which are of most interest for HPC applications are:
| report types | |
summary |
Identify hotspots and collect stacks and call tree information |
hotspots |
Identify hotspots by using hardware counters and ignore stack and call tree |
hw-events |
find low-level hardware issues |
| report options | |
-column |
Include or exclude columns |
filter |
Include or exclude data |
group-by |
specify grouping |
time-filter |
specify a time range |
-source-search-dir |
set the path where the source code is stored |
-result-dir |
set the path where the result should be stored |
Example:
First, run a hotspot collection and store the results in a directory (vtune -collect hotspots -r result <target>)
Next, run vtune -report hotspots -r result to receive a report which contains only the data of interest (set by the report-options), e.g. only specific columns like CPU time.
