Difference between revisions of "Intel VTune"
| Line 3: | Line 3: | ||
__TOC__ | __TOC__ | ||
| − | == | + | == General == |
The graphical interface of the Intel VTune Amplifier XE can usually be started by using the command <code>amplxe-gui</code>. The following analysis categories are available: | The graphical interface of the Intel VTune Amplifier XE can usually be started by using the command <code>amplxe-gui</code>. The following analysis categories are available: | ||
| Line 25: | Line 25: | ||
* HPC Performance Characterization | * HPC Performance Characterization | ||
| − | == Hotspot Analysis | + | == Usage == |
| + | |||
| + | The following steps are generally taken to analyze and optimize the code: | ||
| + | |||
| + | === Step 1: Find the Hotspots === | ||
| + | |||
| + | Click on '''Configure Analysis''' and select the Hotspot Analysis (usually selected by default). Configure the analysis by specifying a script or executable and setting necessary parameters and environment variables. Click the start button to start the analysis. Try to keep the amount of other software running on the same machine to a minimum to achieve accurate and reproducable results. Once the analysis has finished, the '''Summary''' window should open automatically and the results must be interpreted. | ||
| + | |||
| + | |||
| + | [[File:Intel-VTune-Hotspot-Summary.png|500px]] | ||
| + | |||
| + | |||
| + | The Elapsed Time shows the total runtime of the application including idle times while CPU Time is the sum of the CPU times of all threads. The Paused time is the total time the application was paused using the GUI, CLI commands or user API. The Top Hotspots section shows the most time-consuming functions sorted by CPU time. Below these one can find a histogram displaying the effective CPU Utilization of the application. | ||
| + | |||
| + | |||
| + | [[File:Intel-VTune-Hotspot-Bottom-up.png|500px]] | ||
| − | |||
| − | + | In the '''Bottom-up''' window one can find detailed information grouped by function and again sorted by CPU time. Functions with high CPU time and large sections of poor CPU utilization should be targeted first. When selecting a function the full stack data will be displayed in the Call Stack section with the following format: | |
| − | + | <code><module>!<function>-<file>:<line></code> (the line being the one calling the next function) | |
| − | |||
| − | + | [[File:Intel-VTune-Hotspot-Thread.png|500px]] | |
| − | |||
| − | + | To analyse the performance per thread the grouping level can be switched to <code>Thread/Function/Call Stack</code>. Furthermore, the timeline below displays the behaviour of each thread during execution. Hovering over the '''Timeline''' itself will show the elapsed time until that point. The '''Threads''' section shows the CPU utilization per thread, while the '''CPU Utilization section''' shows the overall CPU utilization of the application. | |
| − | |||
| − | + | [[File:Intel-VTune-Hotspot-Source.png|500px]] | |
| − | |||
| − | + | Clicking on a function in the '''Bottom-up''' window (grouped by <code>Thread/Function/Call Stack</code>) will open the source editor at the respective code line. The Assembly window can be opened instead of or additionally to the Source window by ticking the respective boxes in the toolbar. The columns can be reorganized by drag-and-drop and the changes will be saved and used in other projects. | |
| − | The | ||
| − | + | === Step 2: Find Hardware usage bottlenecks === | |
| − | === | + | === Step 3: Optimize memory access performance === |
| − | === | + | === Step 4: Final check === |
== References == | == References == | ||
Revision as of 11:53, 18 April 2019
The Intel VTune™ Amplifier can be used to identify and analyse various aspects in both serial and parallel programs and can be used for both OpenMP and MPI applications.
General
The graphical interface of the Intel VTune Amplifier XE can usually be started by using the command amplxe-gui. The following analysis categories are available:
Hotspots
Information on what parts of the code take up most of the runtime and how they may be optimized
- Hotspots
- Memory Access
Microarchitecture
Information on how efficiently the code utilizes the underlying hardware
- Microarchitecture Exploration
- Memory Access
Parallelism
Information on how efficient the parallelization of the code is
- Threading
- HPC Performance Characterization
Usage
The following steps are generally taken to analyze and optimize the code:
Step 1: Find the Hotspots
Click on Configure Analysis and select the Hotspot Analysis (usually selected by default). Configure the analysis by specifying a script or executable and setting necessary parameters and environment variables. Click the start button to start the analysis. Try to keep the amount of other software running on the same machine to a minimum to achieve accurate and reproducable results. Once the analysis has finished, the Summary window should open automatically and the results must be interpreted.
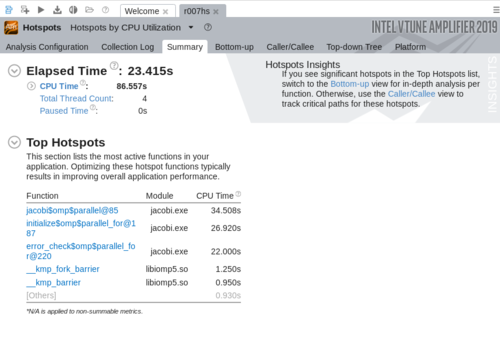
The Elapsed Time shows the total runtime of the application including idle times while CPU Time is the sum of the CPU times of all threads. The Paused time is the total time the application was paused using the GUI, CLI commands or user API. The Top Hotspots section shows the most time-consuming functions sorted by CPU time. Below these one can find a histogram displaying the effective CPU Utilization of the application.
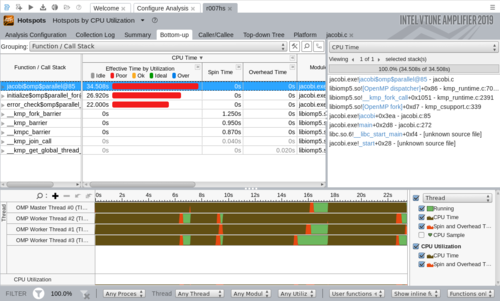
In the Bottom-up window one can find detailed information grouped by function and again sorted by CPU time. Functions with high CPU time and large sections of poor CPU utilization should be targeted first. When selecting a function the full stack data will be displayed in the Call Stack section with the following format:
<module>!<function>-<file>:<line> (the line being the one calling the next function)
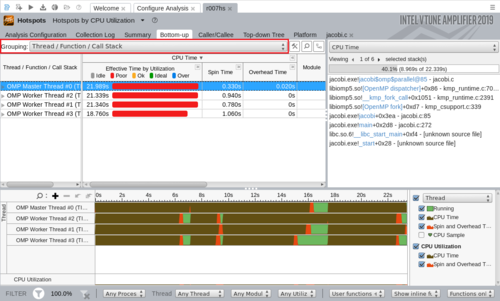
To analyse the performance per thread the grouping level can be switched to Thread/Function/Call Stack. Furthermore, the timeline below displays the behaviour of each thread during execution. Hovering over the Timeline itself will show the elapsed time until that point. The Threads section shows the CPU utilization per thread, while the CPU Utilization section shows the overall CPU utilization of the application.
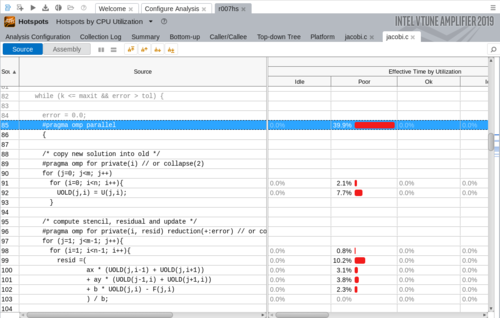
Clicking on a function in the Bottom-up window (grouped by Thread/Function/Call Stack) will open the source editor at the respective code line. The Assembly window can be opened instead of or additionally to the Source window by ticking the respective boxes in the toolbar. The columns can be reorganized by drag-and-drop and the changes will be saved and used in other projects.
Step 2: Find Hardware usage bottlenecks
Step 3: Optimize memory access performance
Step 4: Final check
References
Tutorials by Intel [1]
Intel VTune™ Amplifier Performance Analysis Cookbook [2]


