Totalview in Segments
Introduction
Totalview is a widely used debugger in the field of HPC. This video series provides an introduction to debugging techniques and methodology, and a practical hands-on tutorial on the Totalview debugger.
This tutorial is targeted for software developers as an initial introduction to debugging with Totalview.
How to proceed through this tutorial?
The tutorial is currently made of 5 segments, each detailing on basic debugging techniques. Additional segments, will be added as they are produced. Each video segment uses practical examples, provided as source files, that can be followed along. Access to the Totalview debugger is recommended to follow the tutorial along.
Who created this tutorial?
This tutorial has been developed by the Competence Center for High Performance Computing in Hessen (HKHLR).
The speaker is Dr. Christian Iwainsky from Technische Universiät Darmstadt. Christian works at the university's IT center. The slide are a collective effort of the HKHLR, and video editing was done by himself, with support by Laurin Eisenacher in editing the audio.
Videos
Each video builds on the previous videos. It is recommended to watch all videos in sequence.
Video 1: Introduction to debugging and Totalview
This video provides a brief overview of the debugging process and mindset and then introduces the debugger Totalview.
Totalview Video - Part I
Material:
Totalview - part 1: Slides as pdf
Demo01 - Sources
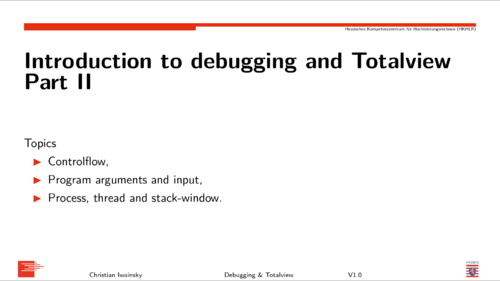
Video 2: Steering the program control flow
This video provides basic knowledge managing control-flow in Totalview using the new user interface. Key aspects are running, pausing, stepping, advancing control-flow, run-to and step-out.
Totalview - part 2
Material:
File:HKHLR Totalview OnlineCourseVideo2 Slides.pdf
Demo01 - Sources
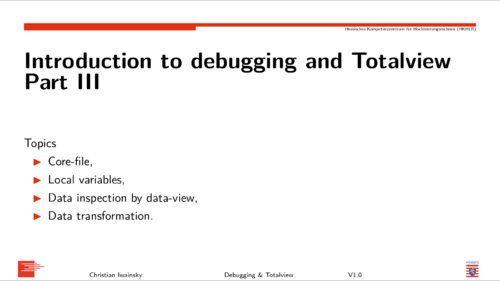
Video 3: Inspecting variables
This video covers core-dump debugging, basic data inspection techniques and data-transformations within Totalview.
Totalview - part 3
Material:
Totalview - part 3: Slides as pdf
Demo02 - Sources
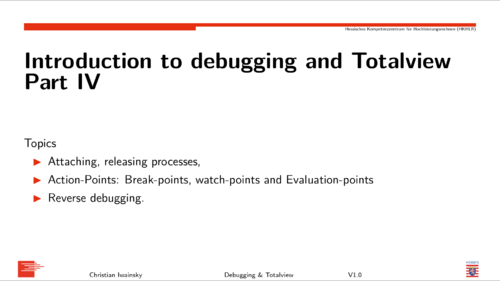
Video 4: Comfort features: action-points, and replay engine
This video covers how to attach to a running program without terminating it, break- watch- and evaluation-points, capable of interrupting execution based on configurable conditions.
Totalview - part 4
Material:
Totalview - part 4: Slides as pdf
Demo03 - Sources
Video 5: Debugging parallel programs in Totalview
This video advances the techniques and methods from videos 1-4 into the parallel domain, covering parallel data inspection, thread and process handling, and using control groups to execute single, and groups of parallel entities.
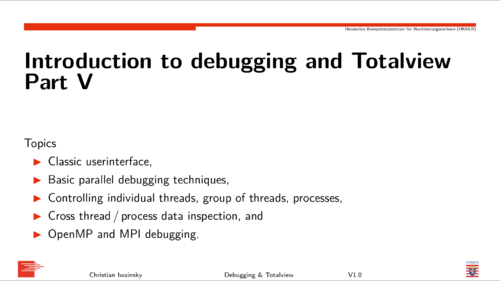
Totalview - part 5
Material:
Totalview - part 5: Slides as pdf
Demo04 - Sources
Demo05 - Sources