Job efficiency
Job efficiency describes how well a job makes use of the available resources.
Efficiency can be viewed from the perspective of the time, that the resource is allocated, or the energy, that is consumed by the hardware during the job runtime, which usually depends on the first.
Therefore, job efficiency is tied to the application performance in that an increase in performance (and decrease in runtime) usually leads to a better efficiency (lower runtime and/or lower energy consumption).
This guideline discusses basics about efficiency measurement, how to spot and mitigate common job efficiency pitfalls and Performance Engineering.
Efficiency measurement
For job efficiency assessment, the utilization of the allocated hardware resources has to be measured. This can be done by performing Performance profiling or by accessing the cluster's Performance Monitoring. The measured Performance metrics give insight into the utilization of the allocated resources and possible deficiencies.
The runtime (or walltime) is easily measured as the time a job was executed from start to finish.
For the energy consumption measurement is more complicated. For one, the energy consumption of the involved hardware has to be measured precisely, which the hardware has to support. On the other hand, it has to be decided which hardware (or percentage thereof) is involved in the execution of the job, which might be difficult for compute systems running shared jobs or resources, such as network hardware, used by many jobs.
For the interpretation of Performance metrics, it is necessary to understand the source of the measured value. Sampled values capture only a very reduced view on the complete system and may be subject to measurement artifacts. Therefore, one has to question the validity of the values and examine how they were produced by the system. Basic knowledge about the measured values includes the minimal and maximal possible values and what system behavior can produce such measurements. For example, how do measurements look like for an idling system and how do they look like for different kinds of synthetic benchmarks?
Common job efficiency pitfalls
The following pitfalls can be spotted using Performance Monitoring or Performance profiling. If Performance Monitoring is available, one can check the measured resource utilization for unexpected characteristics.
Resource oversubscription
Oversubscription of resources happens when the application's assignment of work to resources is flawed. For example, when there are more compute threads than CPU cores, then this leads to thread scheduling overhead and inefficient core utilization. Usually, this indicates a misconfiguration. Either, the application accidentally spawns more worker threads than intended or the job allocation includes too few CPU cores.
Check the following configurations:
- number of spawned worker threads per process (e.g. threads created by OpenMP, OpenBLAS, IntelMKL etc.)
- number of MPI processes
- process/thread Binding/Pinning configuration
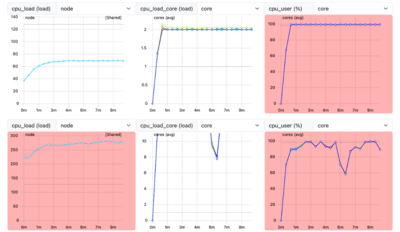
The oversubscription example figure shows two jobs, with more threads than cores. The first job with 2 threads per core and the second one with 16 threads per core. Three metrics are shown: node-level CPU load, core-level CPU load and core-level CPU time. Note the ramp-up phase for the metrics. For the first job, the CPU time measurement shows 100% utilization, although the two threads are competing for the CPU core. For the second job, the CPU time measurement depicts degraded utilization, because of the thread scheduling overhead.
Resource underutilization
Resource underutilization can be simply spotted from measurements with low utilization. While this is not a performance issue per se, the unutilized resources can't be used by other users and are basically wasted.
Check your job allocation for misconfiguration, similar to the Resource oversubscription case. Reduce the allocated resources or configure your application make use of the unused resources.
Load imbalance
Load imbalance occurs when the work is unevenly distributed to the resources. This behavior leads to underutilized resources and waiting for unfinished work. Imbalances can have multiple reasons:
- misconfiguration, e.g. unprecise job allocation
- application specific work distribution, e.g. distribution algorithm uses uneven chunks of work
- communication bottlenecks, e.g. synchronization scheme is inefficient
Imbalances can occur on different levels, for example, between cores on the same node, between sockets of the same node, between multiple nodes, etc.
Filesystem access
Calculations can be slowed down by operations with high latency, for example, main memory accesses or filesystem accesses. Regular accesses to the filesystem can limit the application performance. Accesses to network filesystems are especially slow. Additionally, network operations (and accesses to shared filesystems) are susceptible to the network (and filesystem storage) utilization of other jobs and can impact other job's performance. Impact of filesystem accesses can be mitigated by:
- Reading necessary data into memory before access. Reading of larger contiguous datasets is often faster than irregular accesses.
- Copying necessary data a local filesystem before access, e.g. memory mapped filesystems.
- Writing result data to local filesystems before copying to destination filesystem.
The filesystem access example shows a job with a regular utilization pattern. The network utilization (ib_* metrics) and filesystem metrics (lustre_* metrics) show high utilization due to frequent access of temporary files stored on the network filesystem. This behavior can be mitigated by storing the temporary files on a node-local, potentially memory mapped filesystem.
Scaling
Scaling issues can be sometimes spotted by comparing utilization measurements of jobs with different scaling parameters. For example, load imbalances can occur, when a workload is parallelized to multiple nodes. It is also possible to recognize the effect of degraded performance and increased communication overhead. However, the exact reason for scaling deficiencies have to be investigated during detailed Performance profiling.
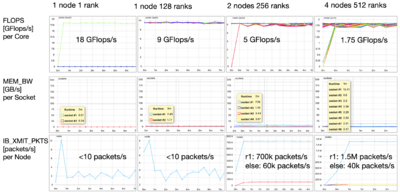
The Scaling performance degradation example shows an application that is executed with four different configurations on 1 core, 128 cores (1 node), 256 cores (2 nodes) and 512 cores (4 nodes). The core-specific Flops metric decreases with increased core count. The memory bandwidth metric increases with the number of involved CPU sockets. The transmitted network packets metric increases once more than a single node is involved. Especially, one particular node transmits more packets than the other nodes. From this example, the communication overhead of increased numbers of cores can be recognized.
Performance expectation and reality
Approaches from Performance_Engineering need to be applied to mitigate job inefficiencies. An application-specific performance model can be created to explain the measured performance and to identify the bottlenecks that limit a performant and efficient execution. If the application's efficiency can't be increased on one hardware platform, one can investigate if the application is more suitable to alternative hardware such as GPUs.


