Performance Patterns
Introduction
The high complexity in making code execute faster on a given machine is caused mostly by the necessity to find a compromise between different requirements. This situation gets worse as machines get more and more complex in design and this complexity is more or less fully exposed to the software.
Initial requirements are related to work necessary to implement a given algorithm. Here it is necessary to distinguish between two notions of work: algorithmic work and processor work. Algorithmic work is whatever the algorithm does: Updating nodes, answering requests, updating voxels etc. This work is then mapped to a high-level programming language and then again mapped to an instruction set. The execution of instructions is the primary processor work. As a result of instruction execution data transfers within the memory hierarchy is a secondary processor work. During this mapping between the different representations of the algorithm additional work may be added due to, e.g., the implementation of a programming model or to implement a barrier. The reduction of algorithmic and processor work is the first and most important step in any optimisation effort.
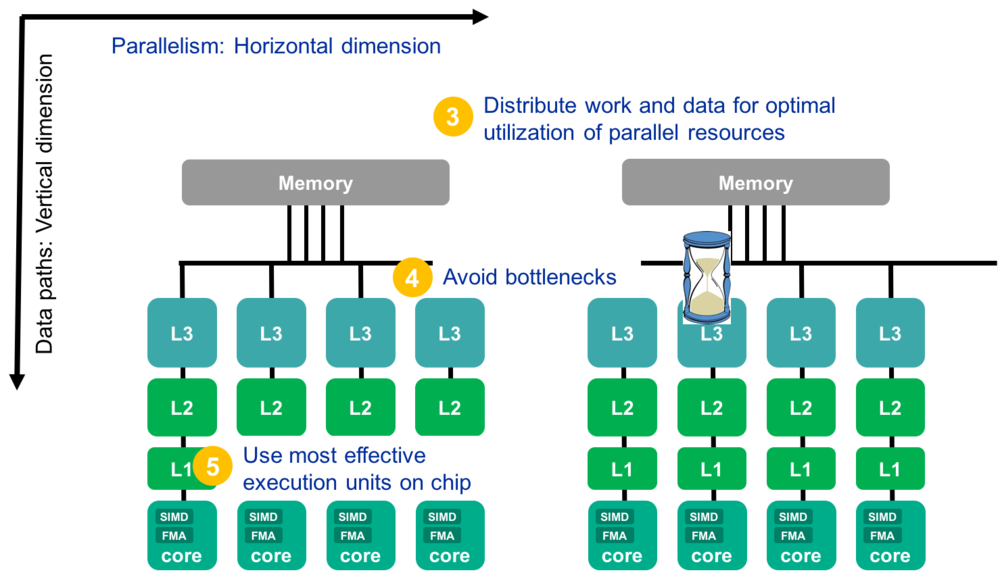
Next are the requirements imposed by a concrete hardware implementation. Modern architectures generate performance mostly by replicating basic building blocks: execution units, cores, memory interfaces, sockets. One of the main tasks is therefore to distribute and utilise those parallel resources as good as possible. This may be seen as the horizontal dimension of optimisation. There are many possible data paths until the data reaches the registers. To optimise this network of data paths it is necessary to avoid or operate at the limit of possible bottlenecks on these paths. This results in reducing data transfers over slow and shared data paths (e.g. memory interfaces) and fully exploiting the available bandwidth over a data path or to fully operate at the design throughput of an execution unit. This can be seen as the vertical dimension of an optimisation effort. Finally modern architectures offer many choices with regard to instructions available for the same operation. Apart from the parallelism those processor features (SIMD, FMA, NT stores and many others) are another main driver for performance. Therefore choosing the most effective instructions for a specific task is crucial to fully exploit processor capabilities.
Process Overview
The PE-Process is valid for a specific test case of a code executed on a specific machine. Because many issues are relevant on the instruction code level only it may also be limited to a specific Compiler/Library/Runtime environment. It can only be employed for a homogeneous portion of the code, those are usually innermost loop nests which consume a significant part of the runtime. Therefore the initial step is to acquire a runtime profile (Caution: Serial and parallel profiles might be different due to different scaling behaviour of different portions of the code). Then the PE-process is carried out separately for every kernel from top of the list to bottom until a satisfying performance is reached.
The process has 3 major steps:
- Analysis: Understanding observed performance. Question to ask: What limits the currently observed performance? Or in other words: Where am I standing at the moment?
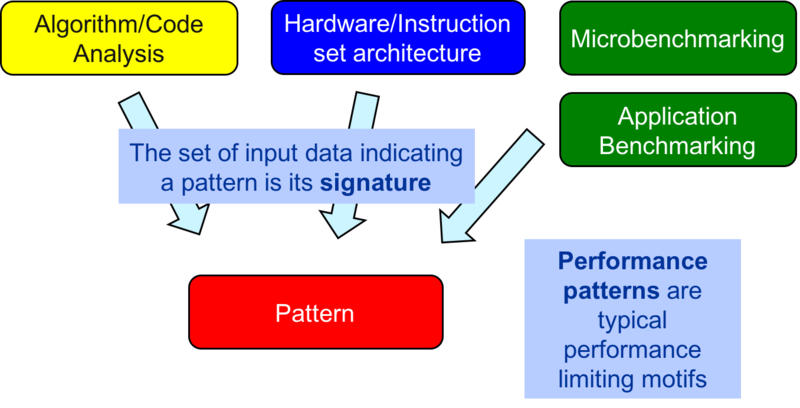
Illustration of PE Analysis Phase:
- Modelling: Validate pattern and get quantitative insight. Question to ask: How bad is it? The model can be seen as a quantitative view of the pattern. This phase might be skipped. Still it is recommended to perform it for critical parts of the code or if complex optimisations are planned.
Illustration of PE Modelling Phase:
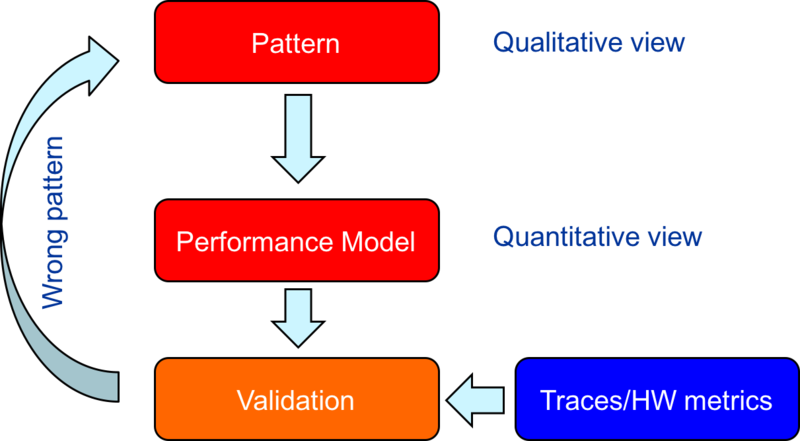
- Optimization: Improve utilisation of available resources and avoid hazards which operating at a bottlenecks design limits. Question to ask: Where do I want to go?
Illustration of PE Optimisation Phase:
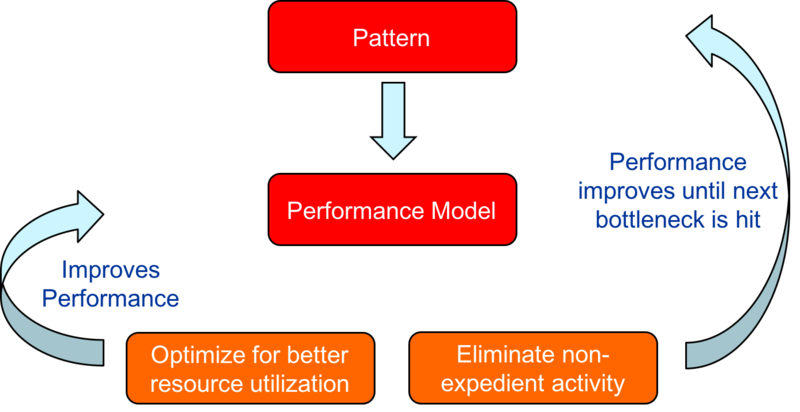
Performance Patterns
The PE process uses the notion of so called performance patterns which package a performance limiting setting with the information how to identify it and possible optimization options. Identifying a pattern is an iterative process involving a hypothesis and findind evidence to proof it.
Performance Patterns are organized in the following classes:
- Maximum resource utilization (computing at a bottleneck)
- Optimal use of parallel resources
- Hazards (something “goes wrong”)
- Use of most effective instructions
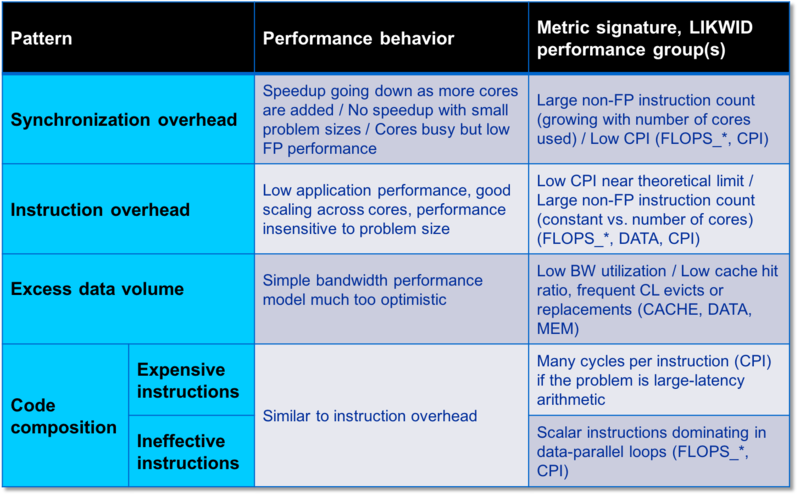
- Work related (too much work or too inefficiently done)
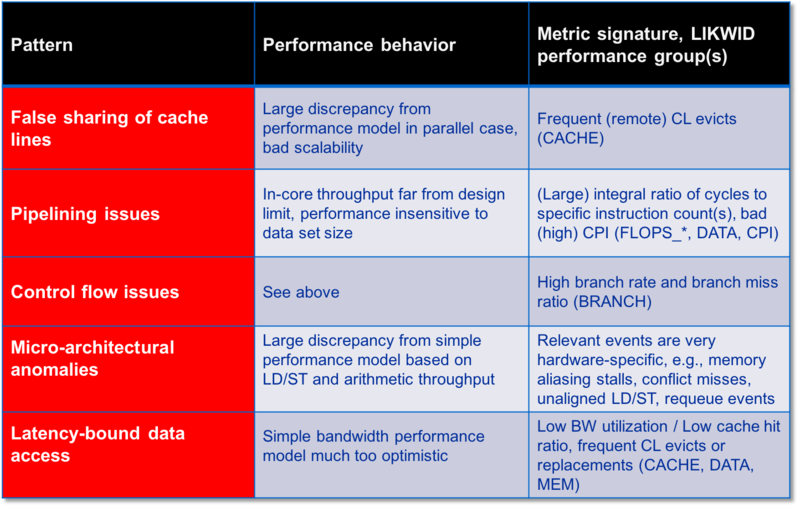
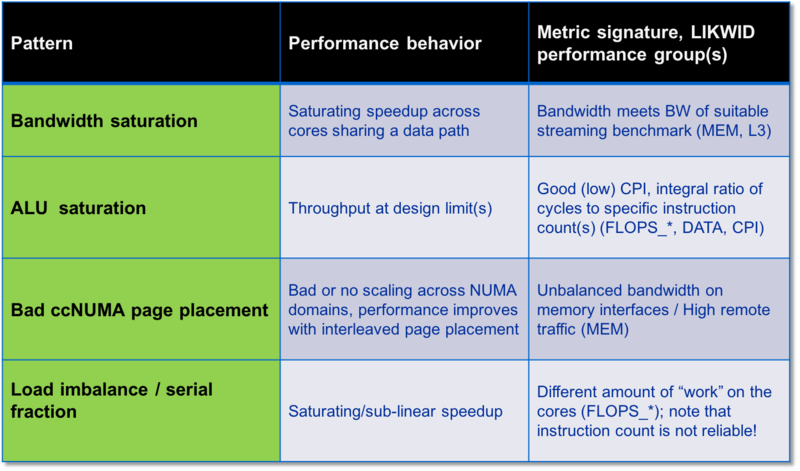
The following tables give a rough overview about patterns common in scientific computing codes.
Bottleneck and Parallelism related patterns:
Strategy
There is no fixed order in which to do things. Still the starting point is always the a runtime profile. What usually follows is a static code review and various application benchmark runs. If possible the innermost loop nests should be profiled using hardware performance monitoring (e.g. using LIKWID marker API) for all scaling runs. For sensible application benchmarking the following requirements must be fulfilled:
- Define relevant test cases which have a short runtime but still reflect the same behaviour as the original production run.
- Ensure a reliable timing
- Establish a performance metric: Best practice is useful application work per time. If it is difficult to identify application work the next best choice is inverse runtime.
- Control the system configuration (this involves BIOS settings and especially frequency): For sensible scaling runs you want to fix the frequency.
For application benchmarking two scaling categories are considered: Parallel scaling and working set size scaling (if possible). For parallel scaling it is important to use correct baselines. The following regimes proofed to produce meaningful results:
- Scale within a ccNUMA domain. Baseline 1 core.
- Scale ccNUMA domains within one socket (package). Baseline: 1 ccNUMA domain.
- Scale sockets within one node. Baseline: 1 socket.
- For any domain (e.g. Socket or node) compare with and without SMT (different SMT levels if available)
- Scale across nodes. Baseline: 1 node.
- On one core: Scale data set size in small steps from fitting inside L1 till clearly in memory.
Things to check first:
- Load balancing and serial fraction
- Memory bandwidth saturation

