Intel VTune
The Intel VTune™ Amplifier can be used to identify and analyse various aspects in both serial and parallel programs and can be used for both OpenMP and MPI applications.
Usage
The following general profiling options are available:
- Hotspot Analysis
- Concurrency Analysis
- Hardware Performance Counter Support
- IO waits
- False Sharing
Hotspot Analysis
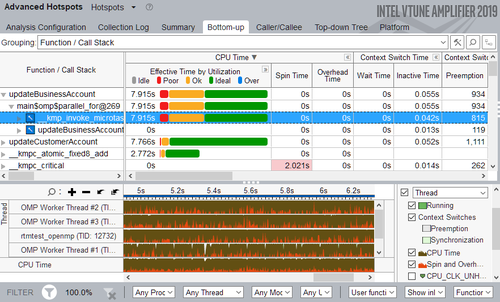
The hotspot analysis is typically the first analysis done in the progress of optimization. It identifies compute-intensive parts in the code and also evaluates the utilization of the available hardware. The summary window should open automatically by default. There, when using multiple OpenMP Threads, both the measured serial and parallel times are shown as well as an estimated ideal parallel time to give you an idea of how much improvement may be possible. Next, there should be a section listing the different OpenMP regions in your code and ranking them by improvement potential. The bottom-up window shows the most time-consuming functions, i.e. the hotspots of the code. Issues can be resolved by viewing and editing the actual code lines with the source editor.
It is important not to neglect the serial parts of a code, as these can seriously weigh down the performance of the application no matter how efficiently parallelised the rest may be.
Concurrency Analysis
References
Tutorials by Intel [1]
Intel VTune™ Amplifier Performance Analysis Cookbook [2]
