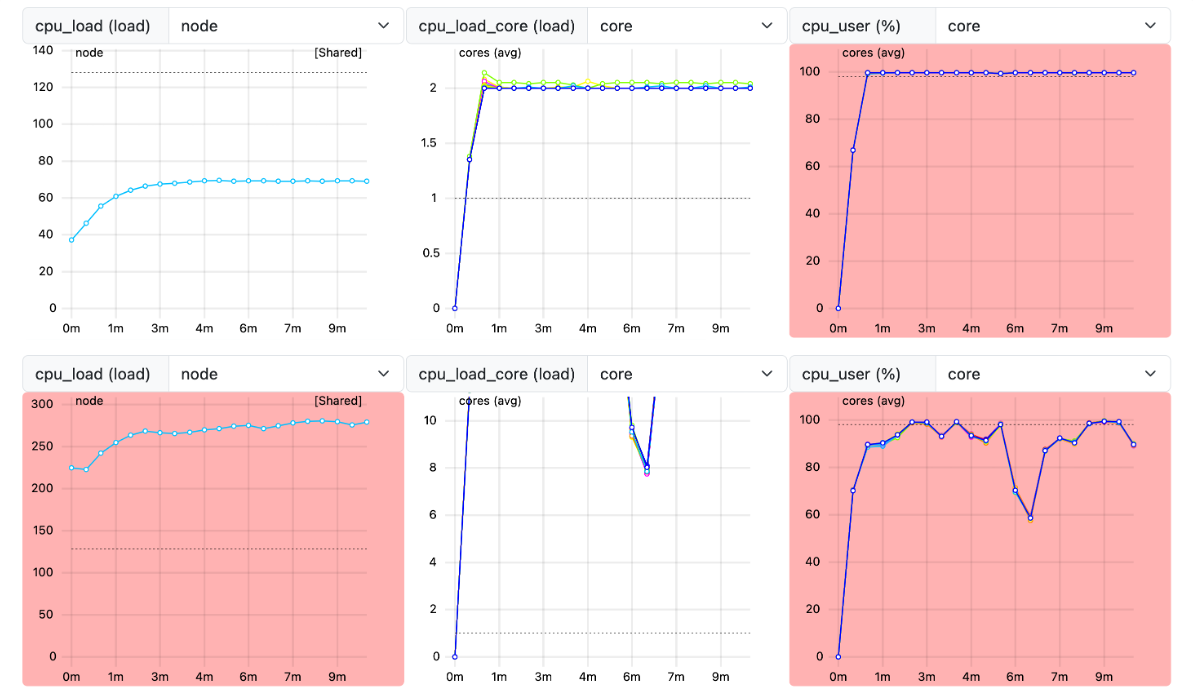
ClusterCockpit plots showing CPU load on the node- and core-level and CPU time metrics for two shared jobs running on 16 cores respectively. The top plots show measurements for a job with 2 threads per core. The bottom plots show measurements for a job with 16 threads per core.


