Uploads by Alex-wiens-5f0c@uni-paderborn.de
Jump to navigation
Jump to search
This special page shows all uploaded files.
| Date | Name | Thumbnail | Size | Description | Versions |
|---|---|---|---|---|---|
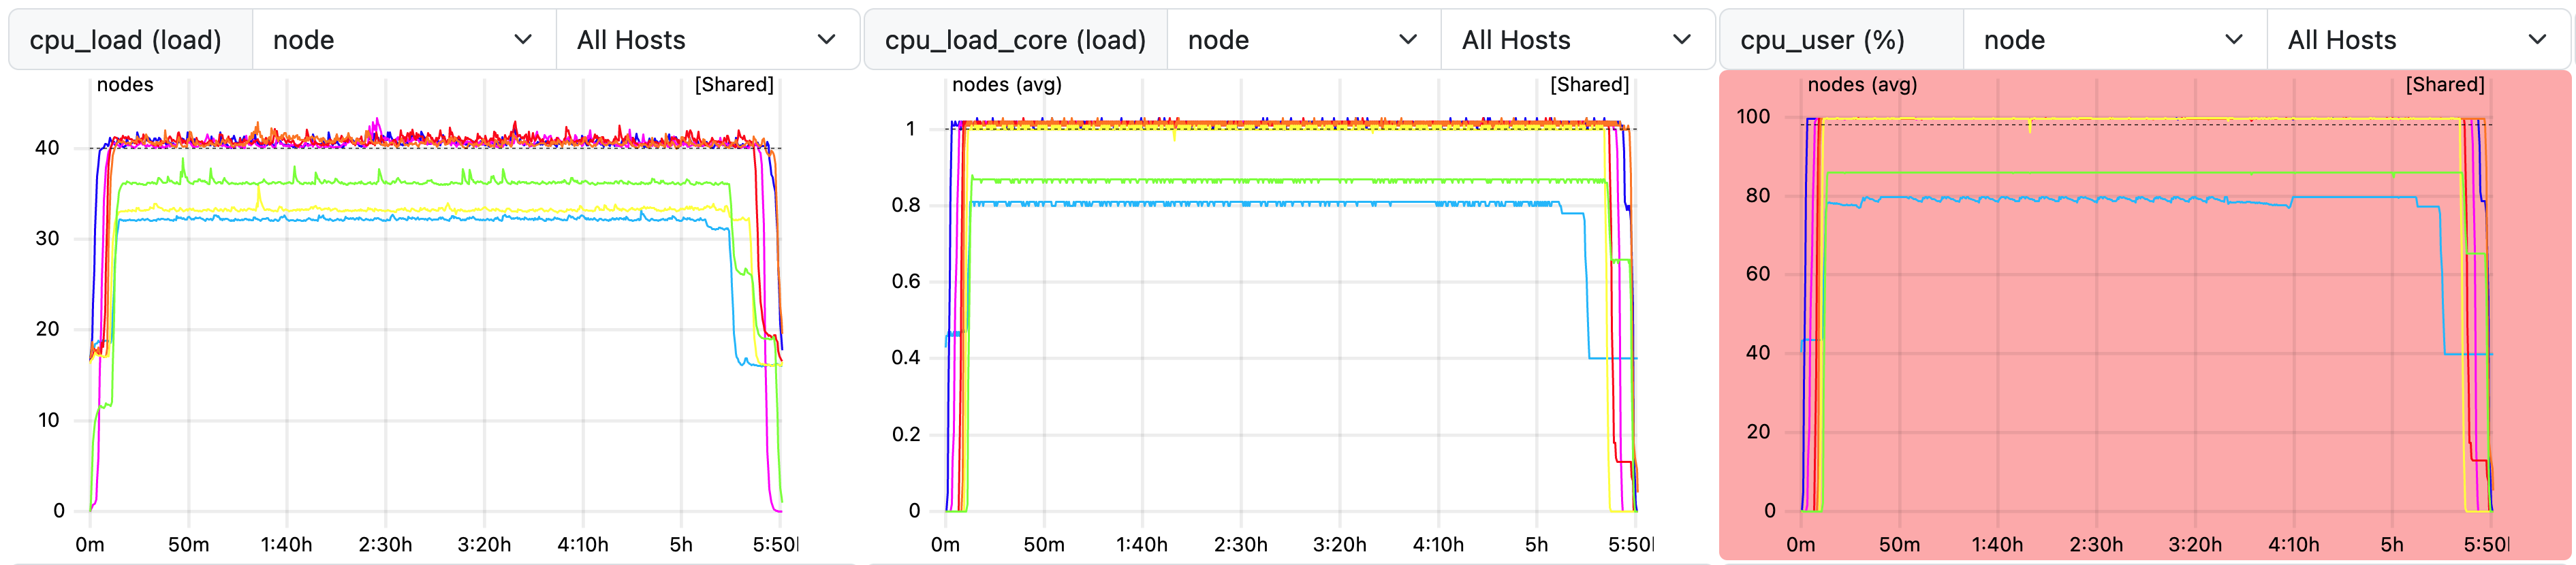
| 18:15, 1 March 2024 | Job efficiency load imbalance.png (file) | 378 KB | The figure shows ClusterCockpit measurements for a job that executes on multiple nodes in shared-mode. Three metrics are shown: node-level CPU load, averaged node-level CPU core load and averaged node-level CPU core time. While the CPU load metric may be influenced by other jobs running on the shared nodes, the CPU core load and CPU core time metrics use core-level measurements. These metrics show a difference in CPU utilization on different nodes. | 1 | |
| 14:10, 29 February 2024 | Job efficiency filesystem access.png (file) |  |
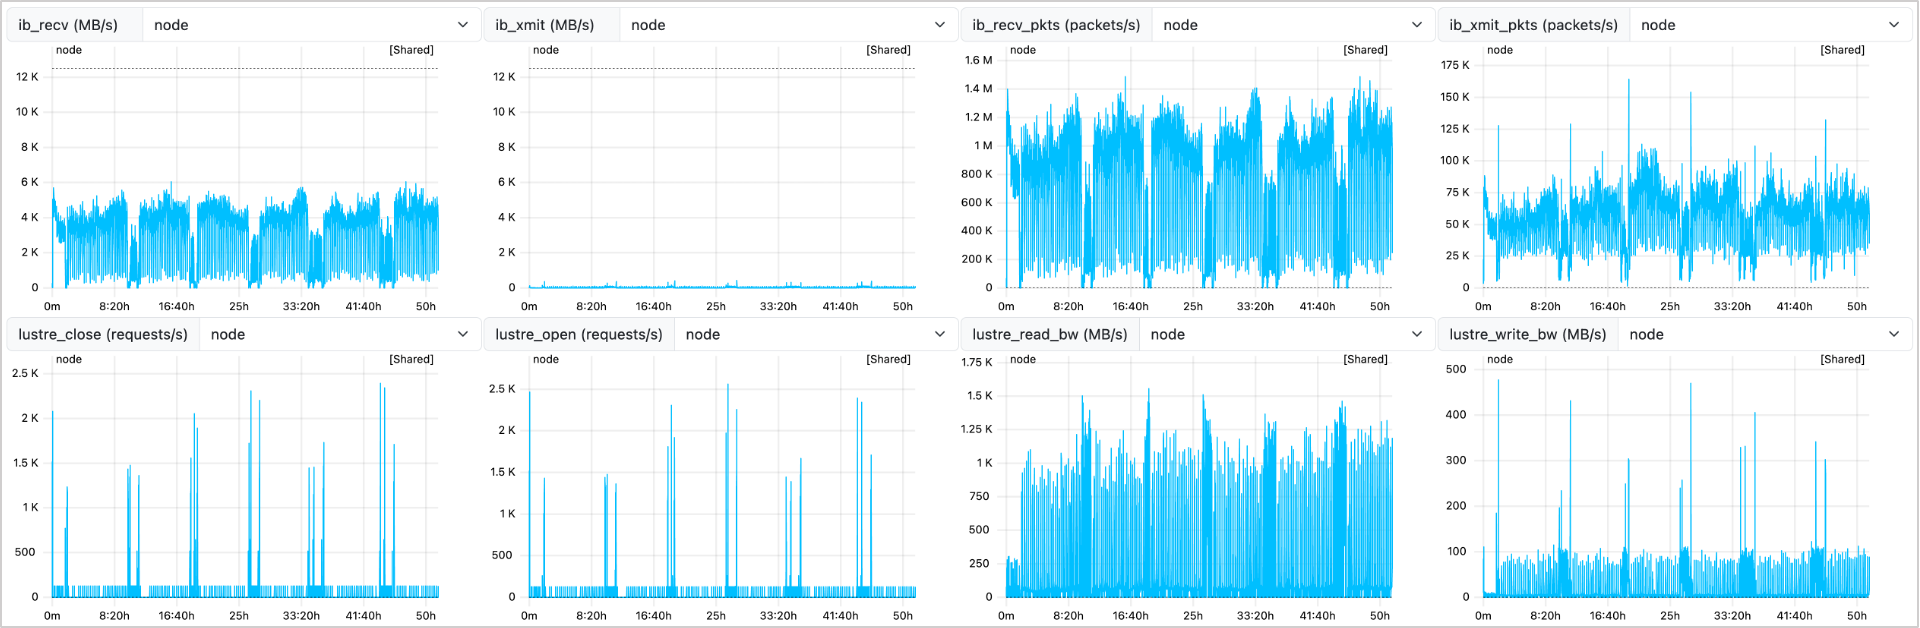
326 KB | The figure shows ClusterCockpit measurement results from job that does regular filesystem operations. These lead to increased network and filesystem utilization. The plots show a regular pattern in the application behavior. | 1 |
| 19:24, 28 February 2024 | Job efficiency scaling performance degradation.png (file) |  |
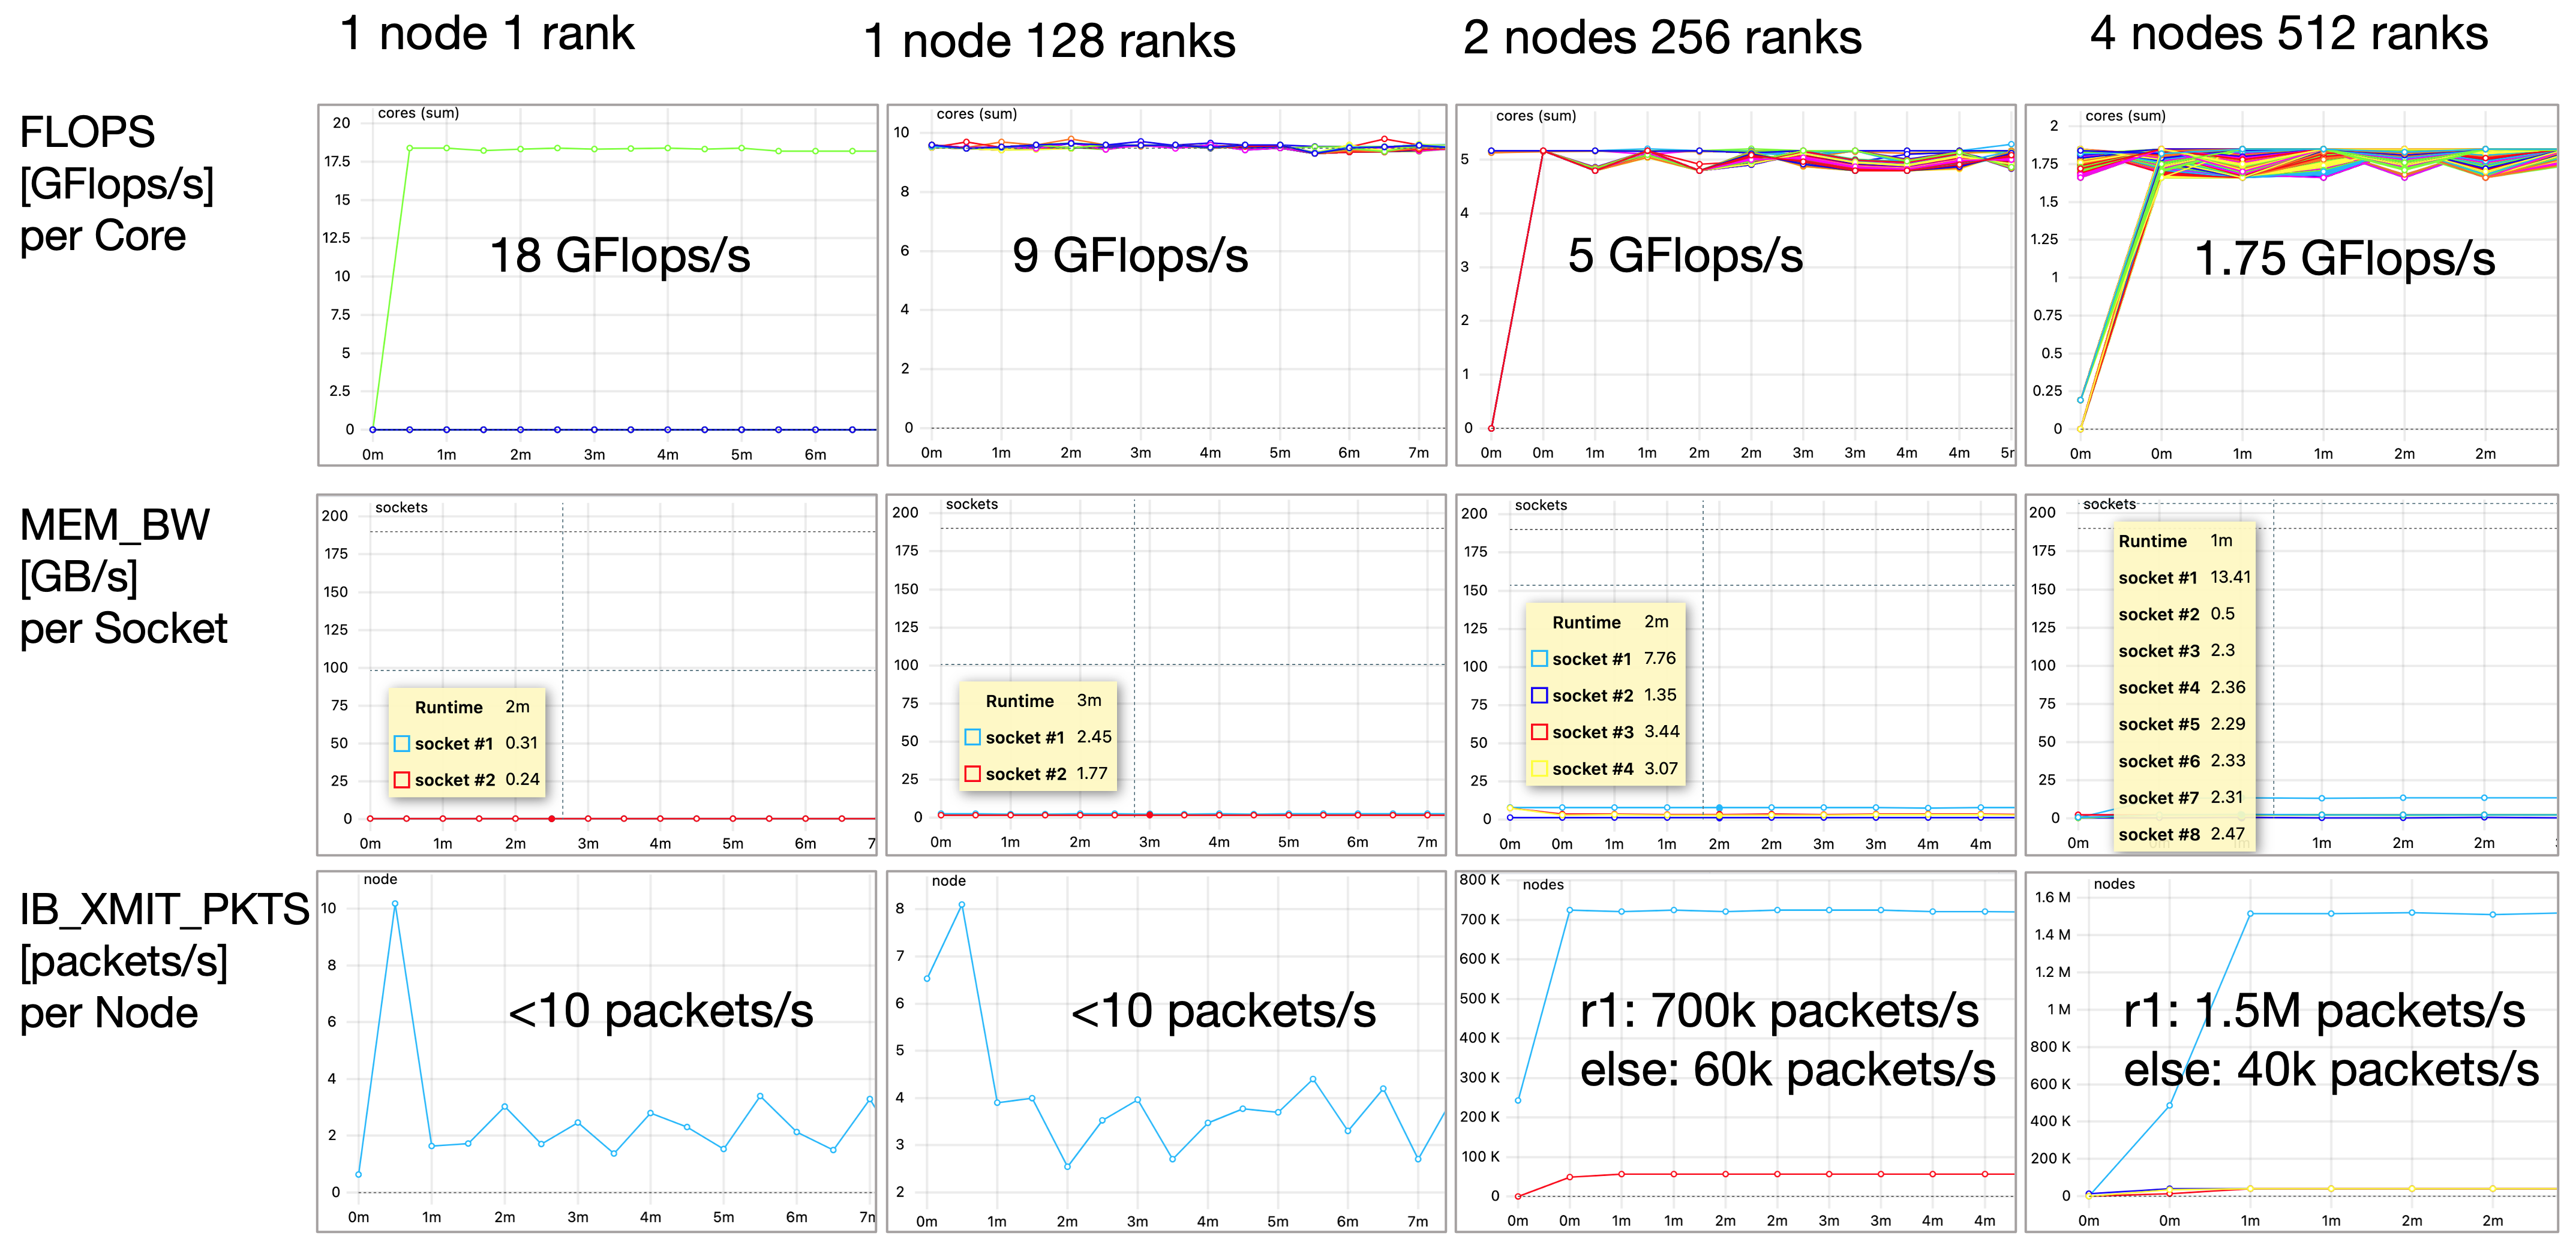
1.57 MB | The image shows ClusterCockpit measurement results for an application that is executed with multiple scaling configurations. It is executed with four different configurations on 1 core, 128 cores (1 node), 256 cores (2 nodes) and 512 cores (4 nodes). Three metrics are show for every case: Flops per core, memory bandwidth per socket and transmitted network packets per node. The plots show how with increased number of involved cores and nodes the performance degrades and the communication overh... | 1 |
| 17:54, 27 February 2024 | Job efficiency oversubscription.png (file) |  |
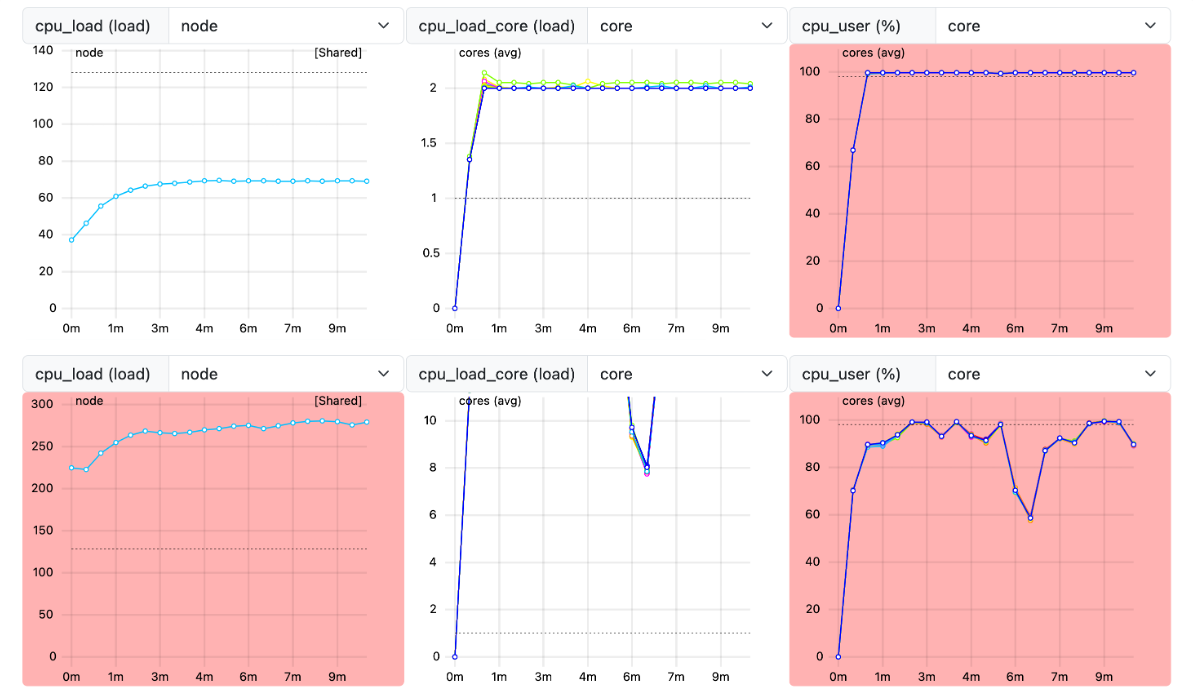
147 KB | ClusterCockpit plots showing CPU load on the node- and core-level and CPU time metrics for two shared jobs running on 16 cores respectively. The top plots show measurements for a job with 2 threads per core. The bottom plots show measurements for a job with 16 threads per core. | 1 |