Oracle Sampling Collector and Performance Analyzer
The Oracle Sampling Collector and the Performance analyzer are a pair of tools that can be used to collect and analyze performance data for serial or parallel applications. Therefor the Sampling Collector gathers performance data by sampling at regular time intervals and by tracing function calls. These information is gathered in so-called experiment files, which can then be displayed by the Performance Analyzer.
The Oracle Sampling Collector
In order to collect performance data it is first recommended to compile the program with debug information using the -g flag. This ensures source line attribution and full functionality of the analyzer. Performance data can then be gathered by linking the program as usual and running it under the control of the Sampling Collector with the command:
$ collect a.out
Profile data is gathered every 10 milliseconds and written to the experiment file test.1.er by default. The filename number is automatically incremented on subsequent experiments. In fact the experiment file is an entire directory with a lot of information. In order to manipulate these it is recommended to use the provided utility commands er_mv, er_rm, er_cp to move, remove or copy these directories. This makes sure that time stamps are preserved, for example.
Options
Many different kinds of performance data can be gathered by specifying the right options. To get a list of all available hardware counters just invoke the following command:
$ collect -h
Most of the times it is hardly possible to use more than 4 counters in the same measurement since some counters use the same resources and thus conflict with each other. The most important collect options are listed in the table below:
| Option | Description |
|---|---|
-p on | off | hi | lo |
Clock profiling ('hi' needs to be supported on the system) |
-H on | off |
Heap tracing |
-m on | off |
MPI tracing |
-h counter0,on,... |
Hardware Counters |
-j on | off |
Java profiling |
-S on | off | seconds |
Periodic sampling (default interval: 1 sec) |
-o experimentfile |
Output file |
-d directory |
Output directory |
-g experimentgroup |
Output file group |
-L size |
Output file size limit |
-F on | off |
Follows descendant processes |
-C comment |
Puts comments in the notes file for the experiment |
Some hardware counters available on a Skylake CPU that might be useful are listed in the table below:
| Counter | Description |
|---|---|
cycles,on insts,on |
cycle count instruction count |
l3h,on,l3m,on l2h,on,l2m,on dch,on,dcm,on |
L3 cache hits and misses L2 cache hits and misses L1 data-cache hits and misses |
fp_arith_inst_retired.128b_packed_single fp_arith_inst_retired.128b_packed_double fp_arith_inst_retired.256b_packed_single fp_arith_inst_retired.256b_packed_double |
number of SSE/AVX computational 128-bit packed single precision floating-point instructions retired, each count represents 4 computations number of SSE/AVX computational 128-bit packed double precision floating-point instructions retired, each count represents 2 computations number of SSE/AVX computational 256-bit packed single precision floating-point instructions retired, each count represents 8 computations number of SSE/AVX computational 256-bit packed double precision floating-point instructions retired, each count represents 4 computations |
The retired floating-point instructions can be used to calculate the FLOPS rate as follows:
Let fp_arith_inst_retired.128b_packed_single, fp_arith_inst_retired.128b_packed_double, fp_arith_inst_retired.256b_packed_single and fp_arith_inst_retired.256b_packed_double.
Then the number of floating-point operations per time is given by
.
Sampling of MPI programs
MPI programs can be sampled in two different ways:
- by wrapping the MPI binary
- by wrapping the mpiexec
In the first case an example command to start the sampling process could look like this:
$ mpiexec <opt> collect <opt> a.out <opt>
Each MPI process writes its data into its own experiment directory test.*.er.
In the second case the sampling process can be started as follows:
$ collect <opt> -M <MPI> mpiexec <opt> a.out <opt>
All sampling data will be stored in a single "founder" experiment with "subexperiments" for each MPI process.
Note that running collect with a large numer of MPI processes may result in an overwhelming amount of experiment data. Hence, it is recommended to start the program with as few processes as possible.
The Oracle performance Analyzer
After experiment data (e.g. test.1.er) has been obtained by the Sampling Collector it can be evaluated using the Oracle Performance Analyzer as follows:
$ analyzer test.1.er
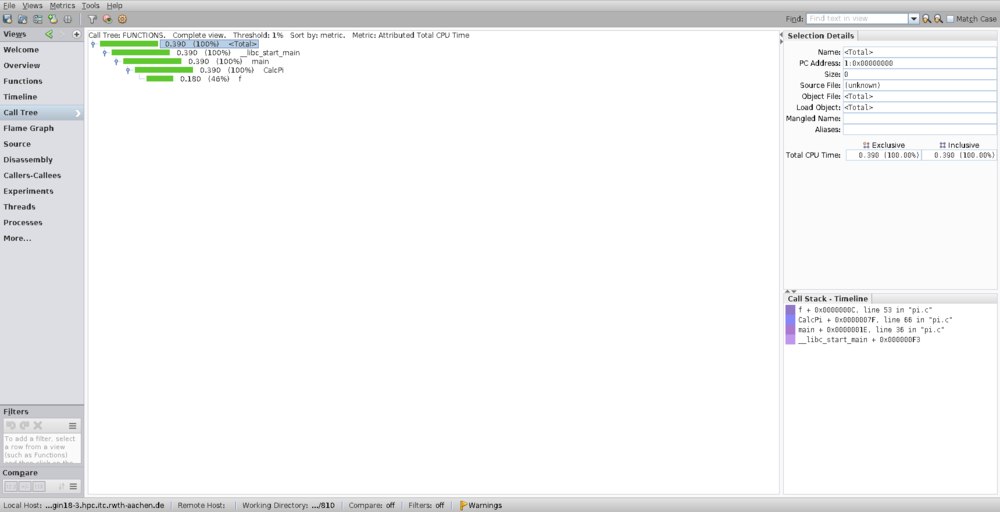
The GUI offers different views. One of them is the call tree which shows in which order function calls happened during the execution of the program. An example call tree is shown in the image below:

This example program just calculates by numerical integration of the function f with from to .


