Interactive Manual Benchmarking
| Tutorial | |
|---|---|
| Title: | Benchmarking & Scaling |
| Provider: | HPC.NRW
|
| Contact: | tutorials@hpc.nrw |
| Type: | Online |
| Topic Area: | Performance Analysis |
| License: | CC-BY-SA |
| Syllabus
| |
| 1. Introduction & Theory | |
| 2. Interactive Manual Benchmarking | |
| 3. Automated Benchmarking using a Job Script | |
| 4. Automated Benchmarking using JUBE | |
| 5. Plotting & Interpreting Results | |
Preparations
Input
It is always a good idea to create some test input for your simulation. If you have a specific system you want to benchmark for a production run make sure you limit the time the simulation is run for. If you also want to test some code given different input sizes of data, prepare those systems (or data-sets) beforehand.
For this tutorials purpose we are using the Molecular Dynamics Code GROMACS as this is a common simulation program and readily available on most clusters. We prepared three test systems with increasing amounts of water molecules which you can download from here:
- Download test input (tgz archive)
- SHA256 checksum:
d1677e755bf5feac025db6f427a929cbb2b881ee4b6e2ed13bda2b3c9a5dc8b0
The unpacked tar archive contains a folder with three binary input files (.tpr), which can directly be used as an input file for GROMACS. Those input files should be compatible with all GROMACS versions equal to or later than 2016.5:
| System | Sidelength of simulation box | No. of atoms | Simulation Type | Default simulation time |
|---|---|---|---|---|
| MD_5NM_WATER.tpr | 5nm | 12165 | NVE | 1ns (500000 steps à 2fs) |
| MD_10NM_WATER.tpr | 10nm | 98319 | NVE | 1ns (500000 steps à 2fs) |
| MD_15NM_WATER.tpr | 15nm | 325995 | NVE | 1ns (500000 steps à 2fs) |
Download the tar archive to your local machine and upload it to an appropriate directory on your cluster.
Unpack the archive and change into the newly created folder:
tar xfa gromacs_benchmark_input.tgz
cd GROMACS_BENCHMARK_INPUT/
Allocate an Interactive Session
As a first measure you should allocate a full single node on your cluster and start an interactive session, i.e. login on the node. Often there are dedicated partitions/queues named "express" or "testing" or the like, for exactly this purpose with a time limit of a few hours. For a cluster running SLURM this could for example look like:
srun -p express -N 1 -n 72 -t 02:00:00 --pty bash
This will allocate 1 node with 72 tasks on the express partition for 2 hours and log you in (i.e. start a new bash shell) on the allocated node. Adjust this according to your cluster's provided resources! On the nodes we are using for this tutorial, hyperthreading is enabled. This means we requested 72 logical cores but actually only run on 36 physical cores. Keep this in mind as we also want to see the effect this has on our simulation.
Weak Scaling
Test-Run
Next, you want to navigate to your input data and load the environment module, which gives you access to GROMACS binaries. Since environment modules are organized differently on many cluster the steps to load the correct module might look different at your site.
module load GROMACS
We will make a first test run using the smallest system (5nm) and 18 cores to get a feeling for how long one simulation might take. Note that we are using the gmx_mpi executable which allows us to run the code on multiple compute nodes later. There might be a second binary available on your system just called "gmx", using a threadMPI parallelism, which is only suitable for shared memory systems (i.e. a single node).
srun -n 18 gmx_mpi -quiet mdrun -deffnm MD_5NM_WATER -nsteps 10000
srun -n 18 will spawn 18 processes calling the gmx_mpi executable. mdrun -deffnm MD_5NM_WATER tells GROMACS to run a molecular dynamics simulation and use the MD_5NM_WATER.tpr as its input. -nsteps 10000 tells it to only run 10000 steps of the simulation instead of the default 500000. We also added the -quiet flag to suppress some general output as GROMACS is quiet chatty.
Output
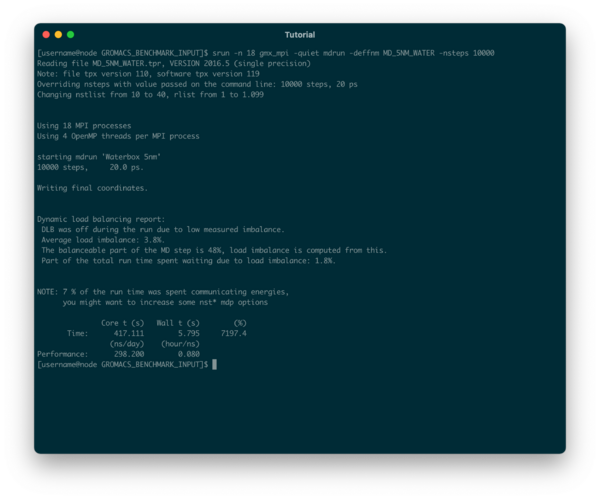
The simulation will presumably take a couple of seconds and the output will look similar to this:
GROMACS gives out a lot of useful information about the simulation we just ran. First it tells us, how many MPI processes were started in total
Using 18 MPI processes
We also get the information that for every MPI process we started, 4 OpenMP threads were created as well
Using 4 OpenMP threads per MPI process
At the end of the output, we will be given some performance metrics:
- Wall time (or elapsed real time): 5.795s
- Core time (accumulated time of each core): 417.111s
- ns/day (nanoseconds one could simulate in 24h): 298.200
- hours/ns (how many hours to simulate 1ns): 0.080
- The total percentage of CPU usage (max = cores*100%): 7197.4%
Live Monitoring with htop
The 18 MPI processes each using 4 OpenMP threads add up to 18x4 (72) cores being used - so all of the resources we allocated when we requested the interactive session. However, we do want a bit more control over how many cores are actually being used. Therefore we can specify an environment variable to limit the number of OpenMP threads, i.e.
export OMP_NUM_THREADS=1
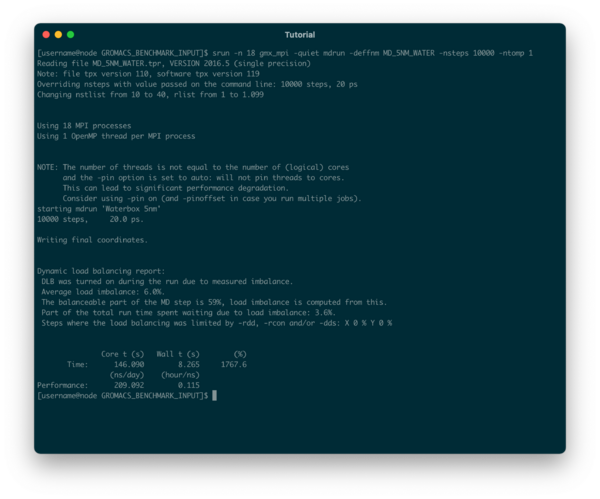
Alternatively we could directly tell GROMACS to only use 1 OpenMP thread per process by adding the flag -ntomp 1.
For the second run we want to test the adjusted parameters and also monitor the CPU cores in real-time. We can do this for example by opening a second shell on the same node. On most clusters it is allowed to SSH on to a node you currently have allocated resources on. To do this, open a new terminal window (or tab), ssh on to the cluster and then on to the node your interactive session is running on
ssh cluster
ssh node
On the node run the htop program by typing
htop
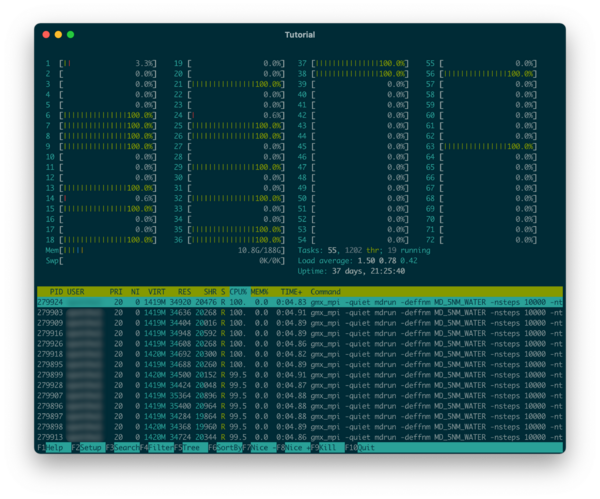
You will see a list of all running processes on the node as well as CPU gauges for all logical cores showing the current CPU usage. We can now run again the GROMACS command with adjusted parameters in the first shell
srun -n 18 gmx_mpi -quiet mdrun -deffnm MD_5NM_WATER -nsteps 10000 -ntomp 1
and monitor the CPUs in the second one:
We can see that 18 cores are running at 100% as we intended. However, we can also observe that these are not always the same cores and the processes seem to randomly jump from one core to another. We can instruct srun to pin those processes to the cores to prevent them from switching around using the flag
--cpu-bind=cores
Running the simulation again with
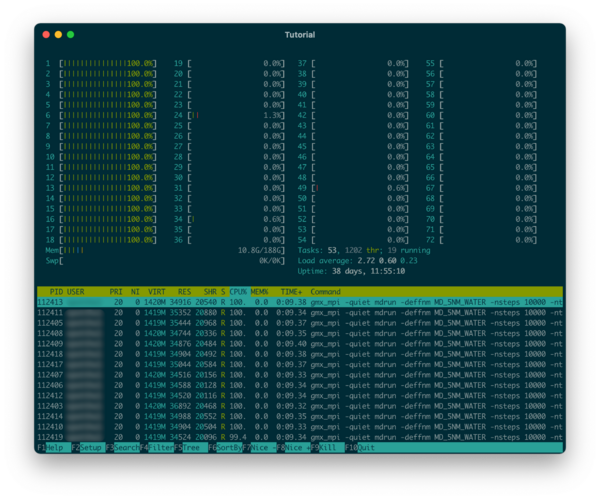
srun --cpu-bind=cores -n 18 gmx_mpi -quiet mdrun -deffnm MD_5NM_WATER -nsteps 10000 -ntomp 1
leads to the behavior as seen in the next screenshot:
Now that we know how to control our simulation, let's start to write a bash script to automate the process for different numbers of cores.
Next: Automated Benchmarking using a Job Script
Previous: Introduction and Theory


